29
/
en
AIzaSyAYiBZKx7MnpbEhh9jyipgxe19OcubqV5w
April 1, 2024
193133
Mauritania
MRT
true
2
1
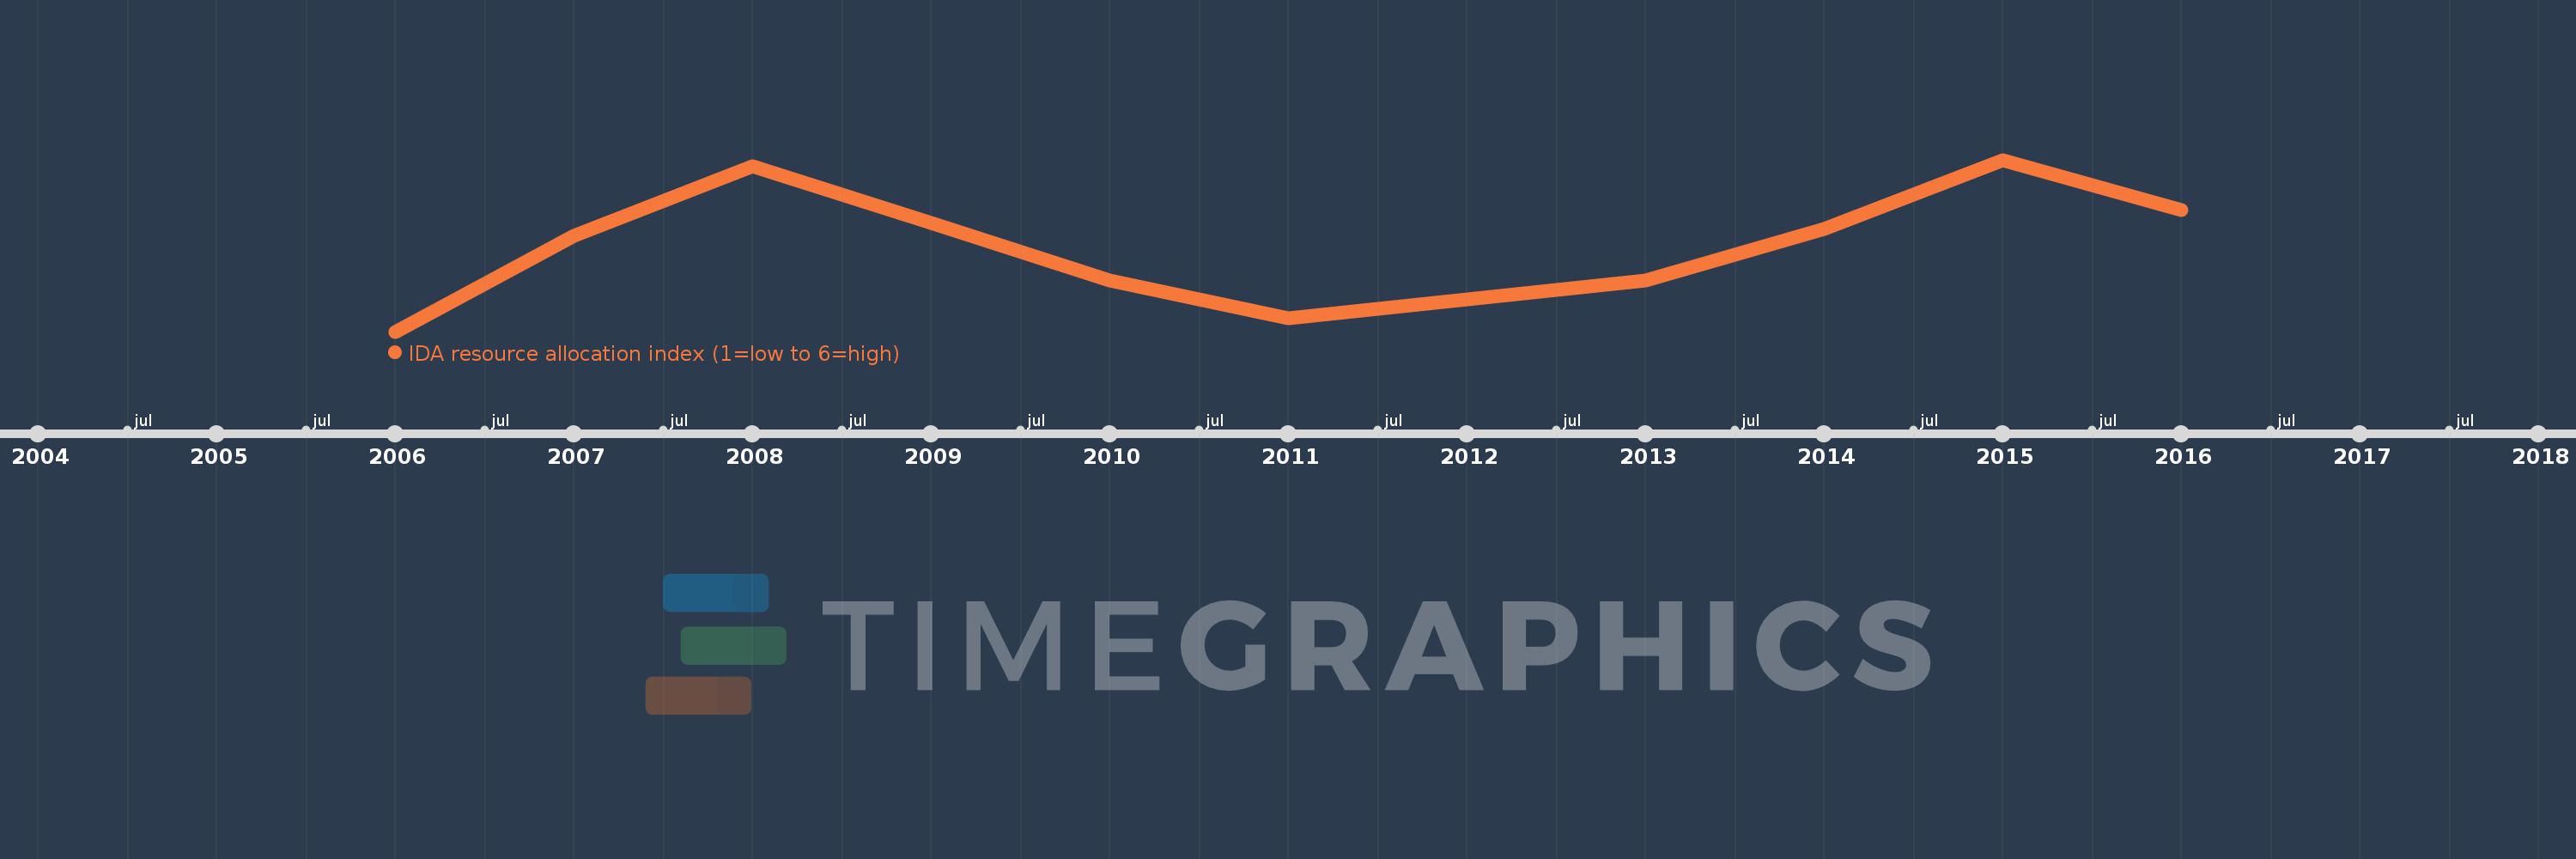
IDA resource allocation index (1=low to 6=high)
2016,2015,2014,2013,2012,2011,2010,2009,2008,2007,2006
This statistics in other country:
Timeline:
This timeline shows a graph from 2006 to 2016 of Mauritania. No data until 2005. Number of actual observations by date: 11.
Source name:
World Development Indicators
Source organization:
World Bank Group, CPIA database (http://www.worldbank.org/ida).
Categories, topics:
Public Sector
Last updated:
apr 23, 2017
Indicators value changes by year
At the date of observation
Value
Absolute change
Change from previous value
jan 1, 2006
3.158
+3.158
0.0%
jan 1, 2007
3.283
+0.125
3.96%
jan 1, 2008
3.375
+0.092
2.79%
jan 1, 2009
3.3
-0.075
-2.22%
jan 1, 2010
3.225
-0.075
-2.27%
jan 1, 2011
3.175
-0.05
-1.55%
jan 1, 2012
3.2
+0.025
0.79%
jan 1, 2013
3.225
+0.025
0.78%
jan 1, 2014
3.292
+0.067
2.07%
jan 1, 2015
3.383
+0.092
2.78%
jan 1, 2016
3.317
-0.067
-1.97%
Ranking of countries by current statistics by years


Comments: