29
/
en
AIzaSyAYiBZKx7MnpbEhh9jyipgxe19OcubqV5w
April 1, 2024
191415
Malta
MLT
true
2
1
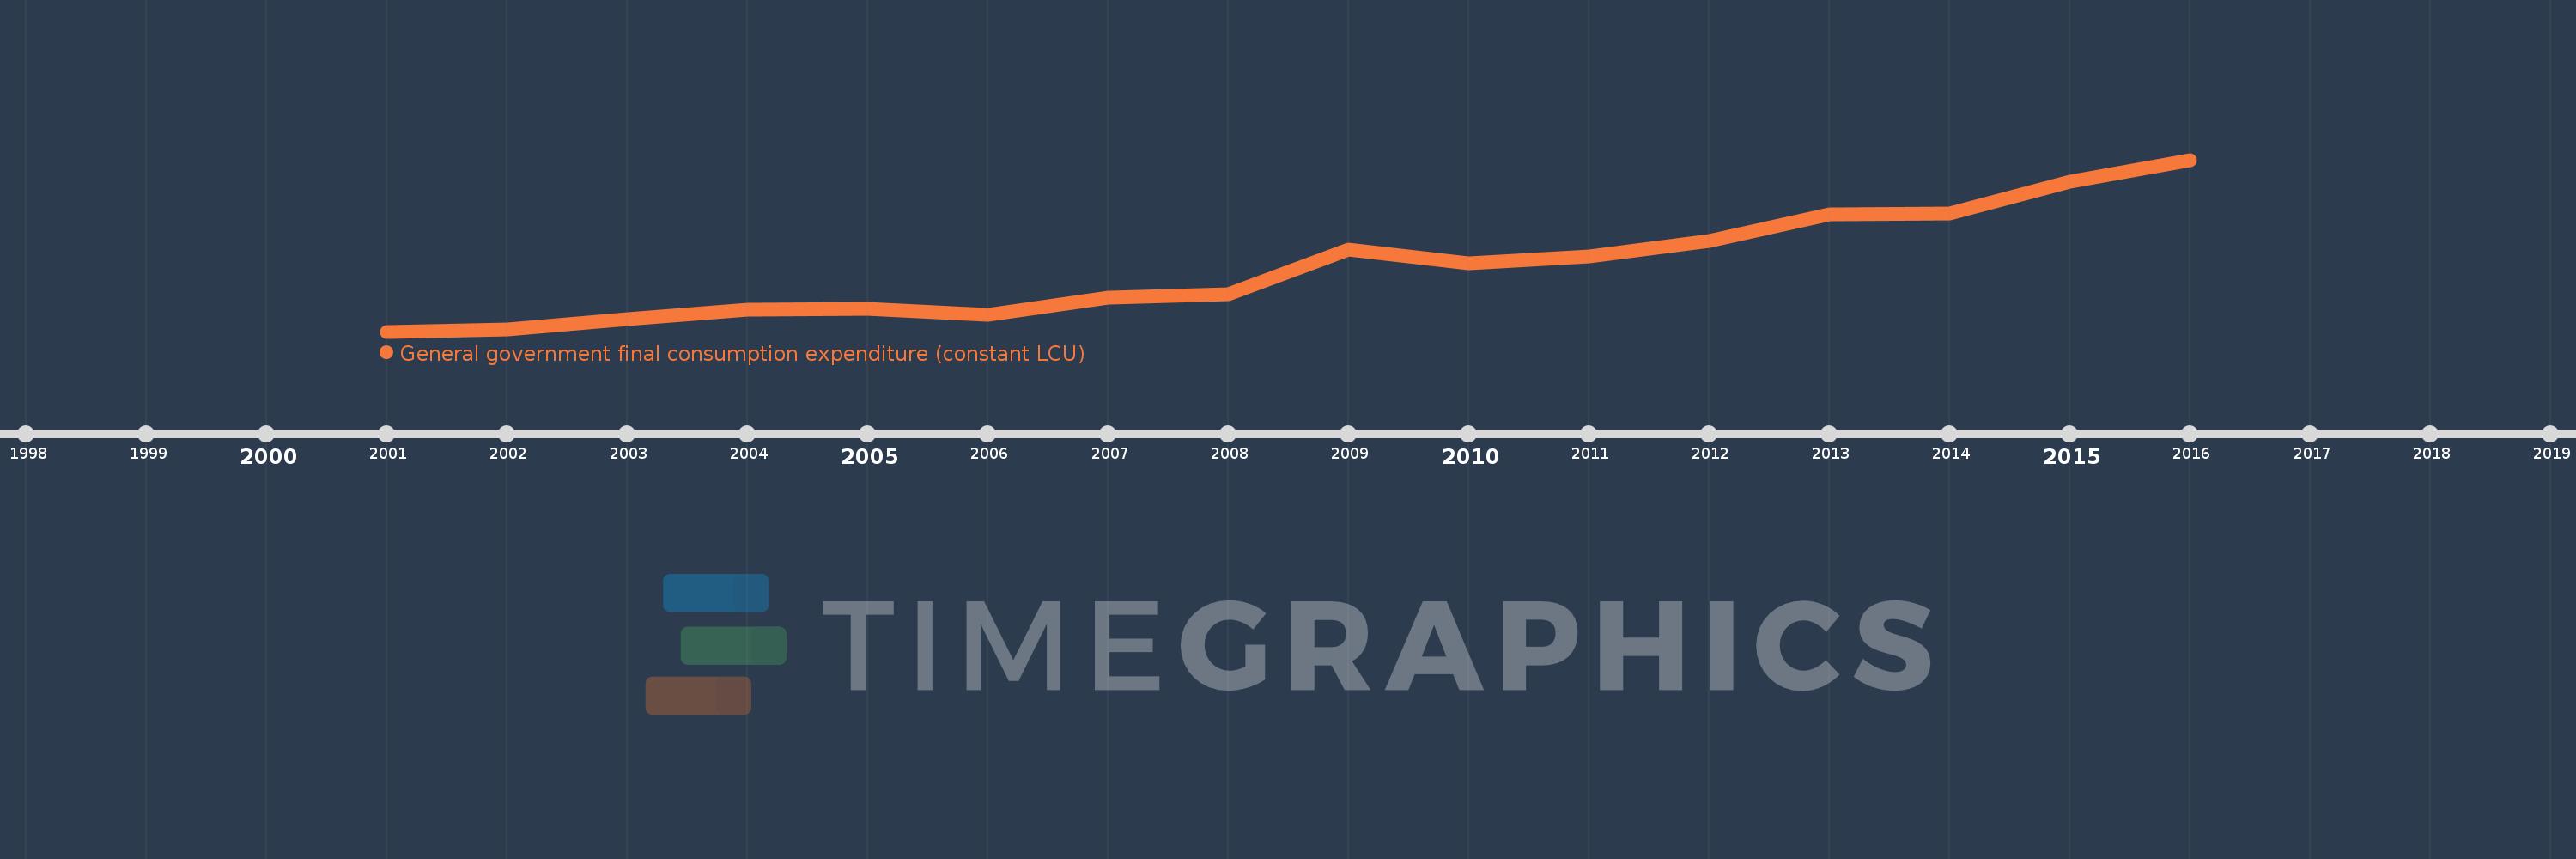
General government final consumption expenditure (constant LCU)
2016,2015,2014,2013,2012,2011,2010,2009,2008,2007,2006,2005,2004,2003,2002,2001
This statistics in other country:
AlbaniaAlgeriaAngolaAntigua and BarbudaArgentinaArmeniaAustraliaAustriaAzerbaijanBahamas, TheBahrainBangladeshBarbadosBelarusBelgiumBelizeBeninBhutanBoliviaBosnia and HerzegovinaBotswanaBrazilBrunei DarussalamBulgariaBurkina FasoBurundiCabo VerdeCambodiaCameroonCanadaChadChileChinaColombiaComorosCongo, Dem. Rep.Congo, Rep.Costa RicaCote d'IvoireCroatiaCubaCyprusCzech RepublicDenmarkDjiboutiDominican RepublicEcuadorEgypt, Arab Rep.El SalvadorEquatorial GuineaEritreaEstoniaEthiopiaFijiFinlandFranceGabonGambia, TheGeorgiaGermanyGhanaGreeceGuatemalaGuineaGuinea-BissauHaitiHondurasHong Kong SAR, ChinaHungaryIcelandIndiaIndonesiaIran, Islamic Rep.IrelandIsraelItalyJamaicaJapanJordanKazakhstanKenyaKorea, Rep.KosovoKuwaitKyrgyz RepublicLao PDRLatviaLebanonLiberiaLithuaniaLuxembourgMacao SAR, ChinaMacedonia, FYRMadagascarMalawiMalaysiaMaliMaltaMauritaniaMauritiusMexicoMoldovaMongoliaMontenegroMoroccoMozambiqueNamibiaNepalNetherlandsNew ZealandNicaraguaNigerNigeriaNorwayOmanPakistanPanamaPapua New GuineaParaguayPeruPhilippinesPolandPortugalPuerto RicoQatarRomaniaRussian FederationRwandaSaudi ArabiaSenegalSerbiaSeychellesSierra LeoneSingaporeSlovak RepublicSloveniaSomaliaSouth AfricaSouth SudanSpainSri LankaSudanSurinameSwazilandSwedenSwitzerlandSyrian Arab RepublicTajikistanTanzaniaThailandTimor-LesteTogoTrinidad and TobagoTunisiaTurkeyTurkmenistanUgandaUkraineUnited Arab EmiratesUnited KingdomUnited StatesUruguayVanuatuVenezuela, RBVietnamWest Bank and GazaZambiaZimbabwe Timeline:
This timeline shows a graph from 2001 to 2016 of Malta. No data until 2000. Number of actual observations by date: 16.
Source name:
World Development Indicators
Source organization:
World Bank national accounts data, and OECD National Accounts data files.
Categories, topics:
Economy & Growth
Last updated:
apr 23, 2017
Indicators value changes by year
Minimum:
1.049 bln
jan 1, 2001
Maximum:
1.593 bln
jan 1, 2016
At the date of observation
Value
Absolute change
Change from previous value
jan 1, 2001
1.049 bln
+1.049 bln
0.0%
jan 1, 2002
1.056 bln
+7.2 mln
0.69%
jan 1, 2003
1.088 bln
+31.8 mln
3.01%
jan 1, 2004
1.12 bln
+31.4 mln
2.89%
jan 1, 2005
1.121 bln
+800.0K
0.07%
jan 1, 2006
1.102 bln
-18.3 mln
-1.63%
jan 1, 2007
1.156 bln
+53.5 mln
4.85%
jan 1, 2008
1.166 bln
+10.7 mln
0.93%
jan 1, 2009
1.31 bln
+143.5 mln
12.3%
jan 1, 2010
1.266 bln
-43.7 mln
-3.34%
jan 1, 2011
1.286 bln
+20.2 mln
1.6%
jan 1, 2012
1.336 bln
+49.3 mln
3.83%
jan 1, 2013
1.421 bln
+85.3 mln
6.39%
jan 1, 2014
1.423 bln
+2.0 mln
0.14%
jan 1, 2015
1.523 bln
+99.7 mln
7.01%
jan 1, 2016
1.593 bln
+70.2 mln
4.61%
Ranking of countries by current statistics by years


Comments: