29
/
en
AIzaSyAYiBZKx7MnpbEhh9jyipgxe19OcubqV5w
April 1, 2024
190752
Mali
MLI
true
2
1
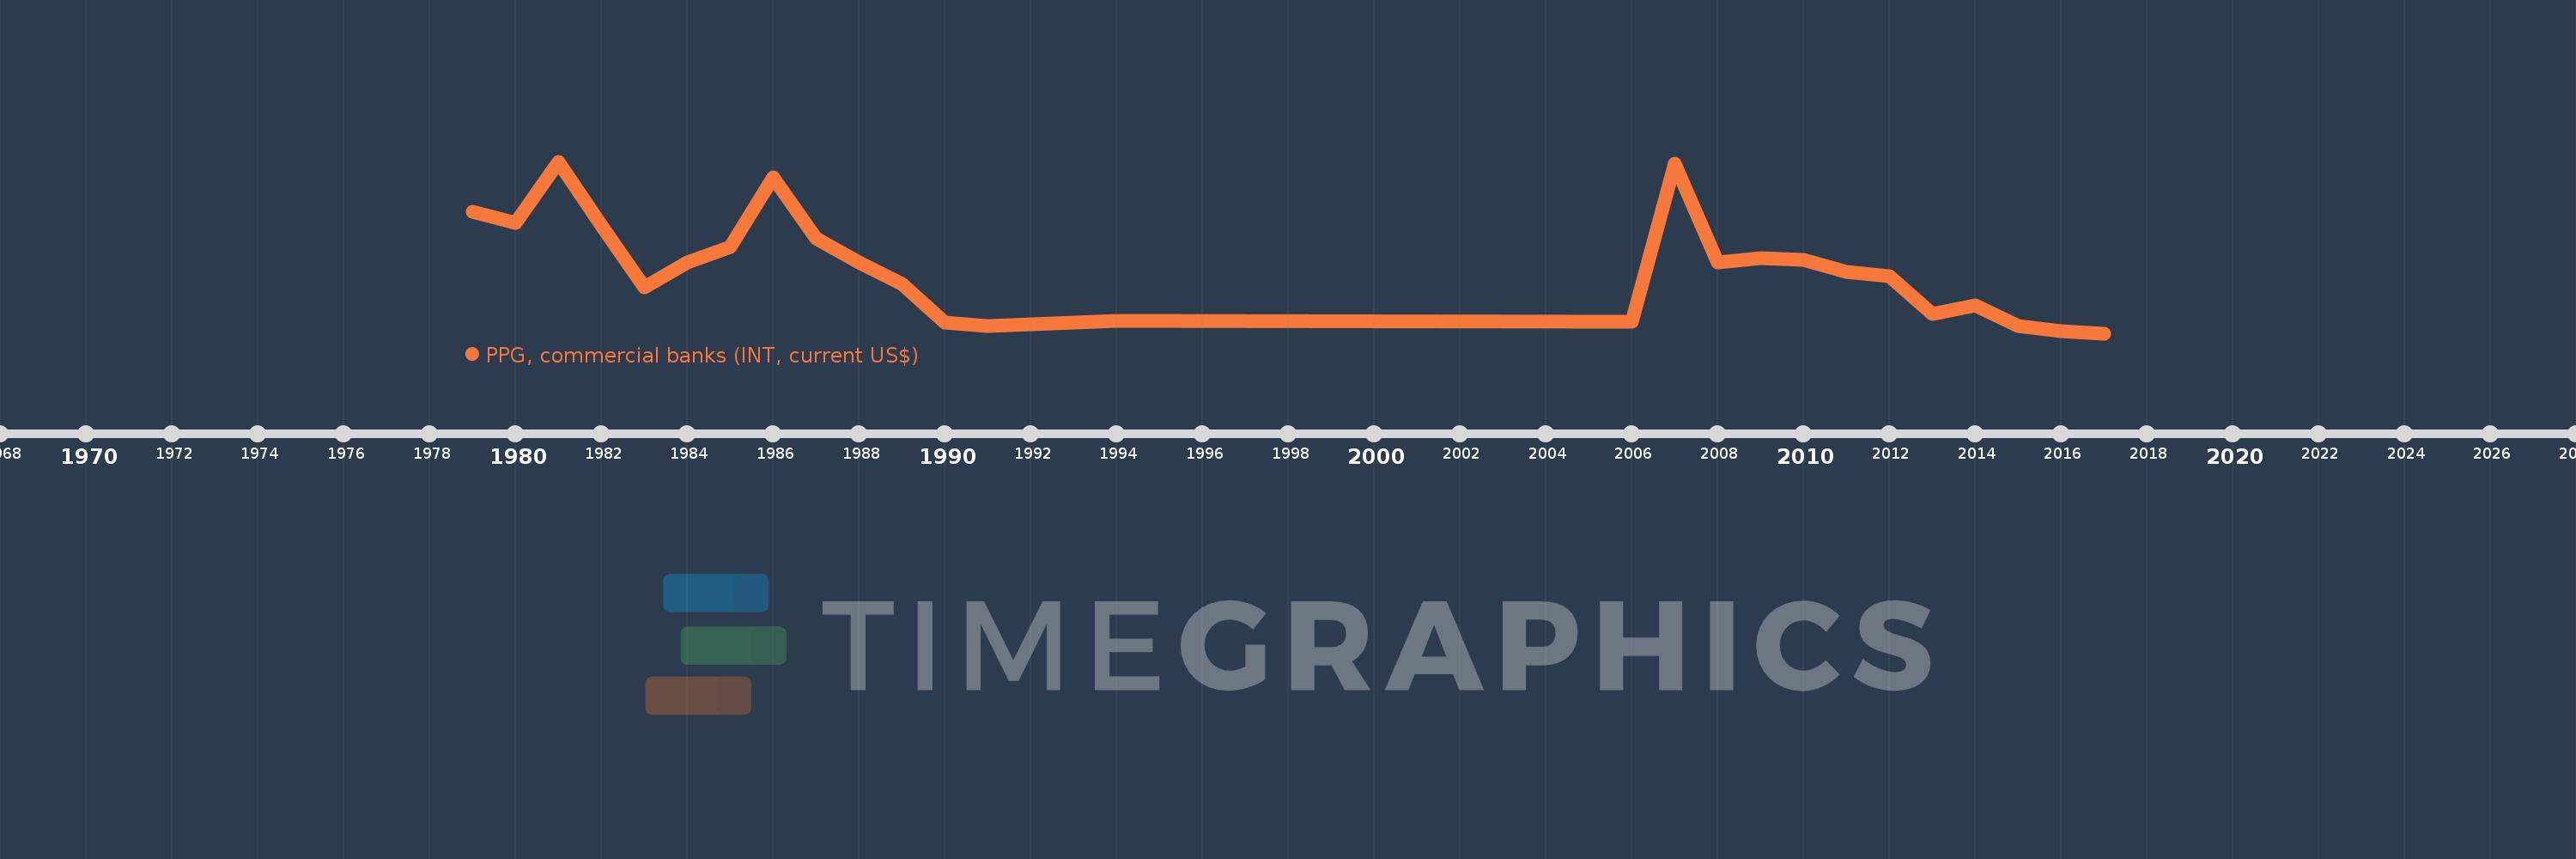
PPG, commercial banks (INT, current US$)
2017,2016,2015,2014,2013,2012,2011,2010,2009,2008,2007,2006,1994,1991,1990,1989,1988,1987,1986,1985,1984,1983,1982,1981,1980,1979
This statistics in other country:
Timeline:
This timeline shows a graph from 1979 to 2017 of Mali. No data until 1978. Number of actual observations by date: 26.
Source name:
World Development Indicators
Source organization:
World Bank, International Debt Statistics.
Categories, topics:
External Debt
Last updated:
apr 23, 2017
Indicators value changes by year
Maximum:
881.0K
jan 1, 1981
At the date of observation
Value
Absolute change
Change from previous value
jan 1, 1979
622.0K
+622.0K
0.0%
jan 1, 1980
564.0K
-58.0K
-9.32%
jan 1, 1981
881.0K
+317.0K
56.21%
jan 1, 1982
555.0K
-326.0K
-37.0%
jan 1, 1983
237.0K
-318.0K
-57.3%
jan 1, 1984
362.0K
+125.0K
52.74%
jan 1, 1985
443.0K
+81.0K
22.38%
jan 1, 1986
801.0K
+358.0K
80.81%
jan 1, 1987
488.0K
-313.0K
-39.08%
jan 1, 1988
362.0K
-126.0K
-25.82%
jan 1, 1989
253.0K
-109.0K
-30.11%
jan 1, 1990
55.0K
-198.0K
-78.26%
jan 1, 1991
39.0K
-16.0K
-29.09%
jan 1, 1994
63.0K
+24.0K
61.54%
jan 1, 2006
60.0K
-3.0K
-4.76%
jan 1, 2007
869.0K
+809.0K
1.35K%
jan 1, 2008
362.0K
-507.0K
-58.34%
jan 1, 2009
387.0K
+25.0K
6.91%
jan 1, 2010
377.0K
-10.0K
-2.58%
jan 1, 2011
314.0K
-63.0K
-16.71%
jan 1, 2012
293.0K
-21.0K
-6.69%
jan 1, 2013
99.0K
-194.0K
-66.21%
jan 1, 2014
141.0K
+42.0K
42.42%
jan 1, 2015
38.0K
-103.0K
-73.05%
jan 1, 2016
12.0K
-26.0K
-68.42%
jan 1, 2017
0.0
-12.0K
-100.0%
Ranking of countries by current statistics by years


Comments: