29
/
en
AIzaSyAYiBZKx7MnpbEhh9jyipgxe19OcubqV5w
April 1, 2024
189482
Maldives
MDV
true
2
1
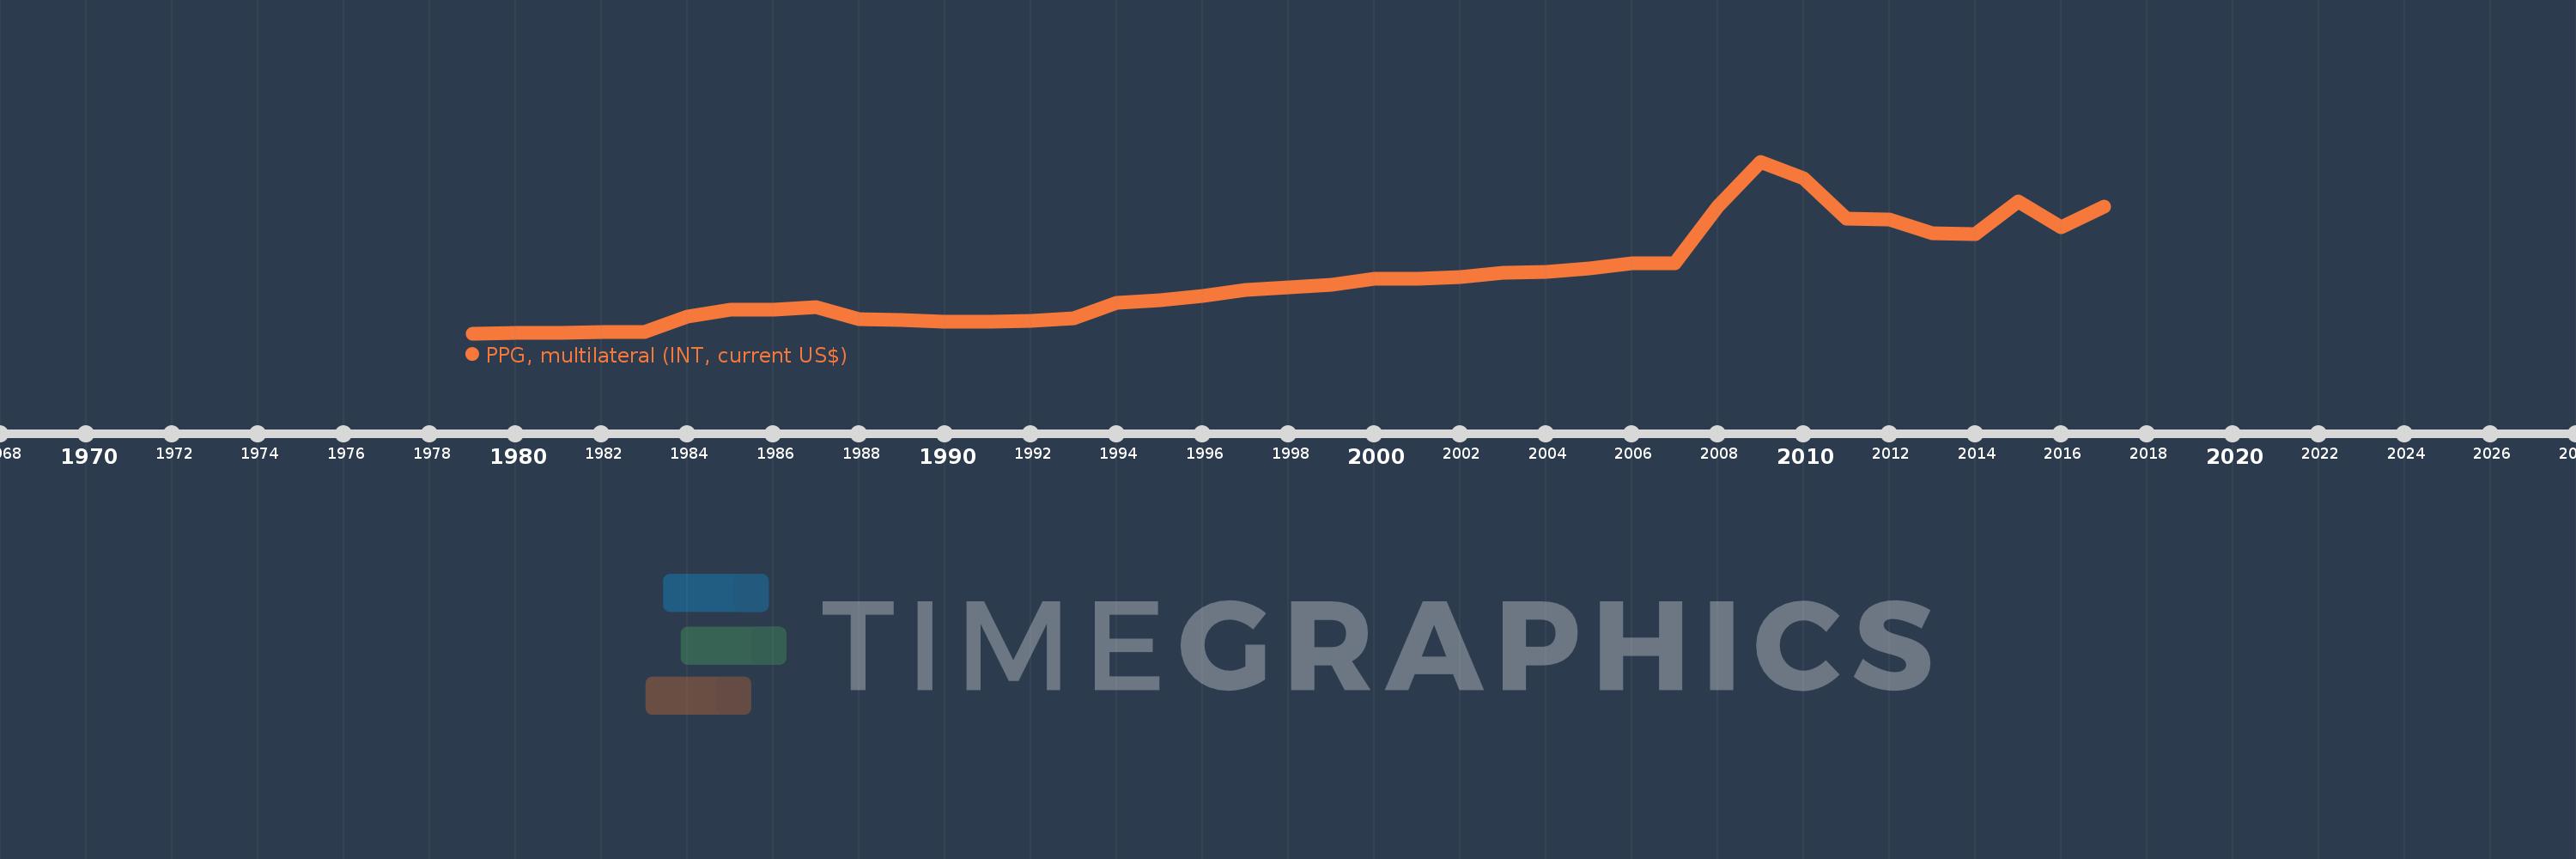
PPG, multilateral (INT, current US$)
2017,2016,2015,2014,2013,2012,2011,2010,2009,2008,2007,2006,2005,2004,2003,2002,2001,2000,1999,1998,1997,1996,1995,1994,1993,1992,1991,1990,1989,1988,1987,1986,1985,1984,1983,1982,1981,1980,1979
This statistics in other country:
Timeline:
This timeline shows a graph from 1979 to 2017 of Maldives. No data until 1978. Number of actual observations by date: 39.
Source name:
World Development Indicators
Source organization:
World Bank, International Debt Statistics.
Categories, topics:
External Debt
Last updated:
apr 23, 2017
Indicators value changes by year
Maximum:
4.643 mln
jan 1, 2009
At the date of observation
Value
Absolute change
Change from previous value
jan 1, 1979
3.0K
+3.0K
0.0%
jan 1, 1980
4.0K
+1000.0
33.33%
jan 1, 1981
8.0K
+4.0K
100.0%
jan 1, 1982
27.0K
+19.0K
237.5%
jan 1, 1983
36.0K
+9.0K
33.33%
jan 1, 1984
444.0K
+408.0K
1.13K%
jan 1, 1985
638.0K
+194.0K
43.69%
jan 1, 1986
649.0K
+11.0K
1.72%
jan 1, 1987
709.0K
+60.0K
9.24%
jan 1, 1988
382.0K
-327.0K
-46.12%
jan 1, 1989
372.0K
-10.0K
-2.62%
jan 1, 1990
305.0K
-67.0K
-18.01%
jan 1, 1991
319.0K
+14.0K
4.59%
jan 1, 1992
332.0K
+13.0K
4.08%
jan 1, 1993
416.0K
+84.0K
25.3%
jan 1, 1994
829.0K
+413.0K
99.28%
jan 1, 1995
902.0K
+73.0K
8.81%
jan 1, 1996
1.02 mln
+118.0K
13.08%
jan 1, 1997
1.183 mln
+163.0K
15.98%
jan 1, 1998
1.254 mln
+71.0K
6.0%
jan 1, 1999
1.315 mln
+61.0K
4.86%
jan 1, 2000
1.487 mln
+172.0K
13.08%
jan 1, 2001
1.467 mln
-20.0K
-1.34%
jan 1, 2002
1.521 mln
+54.0K
3.68%
jan 1, 2003
1.64 mln
+119.0K
7.82%
jan 1, 2004
1.668 mln
+28.0K
1.71%
jan 1, 2005
1.753 mln
+85.0K
5.1%
jan 1, 2006
1.884 mln
+131.0K
7.47%
jan 1, 2007
1.885 mln
+1000.0
0.05%
jan 1, 2008
3.424 mln
+1.539 mln
81.64%
jan 1, 2009
4.643 mln
+1.219 mln
35.6%
jan 1, 2010
4.201 mln
-442.0K
-9.52%
jan 1, 2011
3.089 mln
-1.112 mln
-26.47%
jan 1, 2012
3.076 mln
-13.0K
-0.42%
jan 1, 2013
2.698 mln
-378.0K
-12.29%
jan 1, 2014
2.691 mln
-7.0K
-0.26%
jan 1, 2015
3.566 mln
+875.0K
32.52%
jan 1, 2016
2.858 mln
-708.0K
-19.85%
jan 1, 2017
3.414 mln
+556.0K
19.45%
Ranking of countries by current statistics by years


Comments: