29
/
en
AIzaSyAYiBZKx7MnpbEhh9jyipgxe19OcubqV5w
April 1, 2024
189443
Maldives
MDV
true
2
1
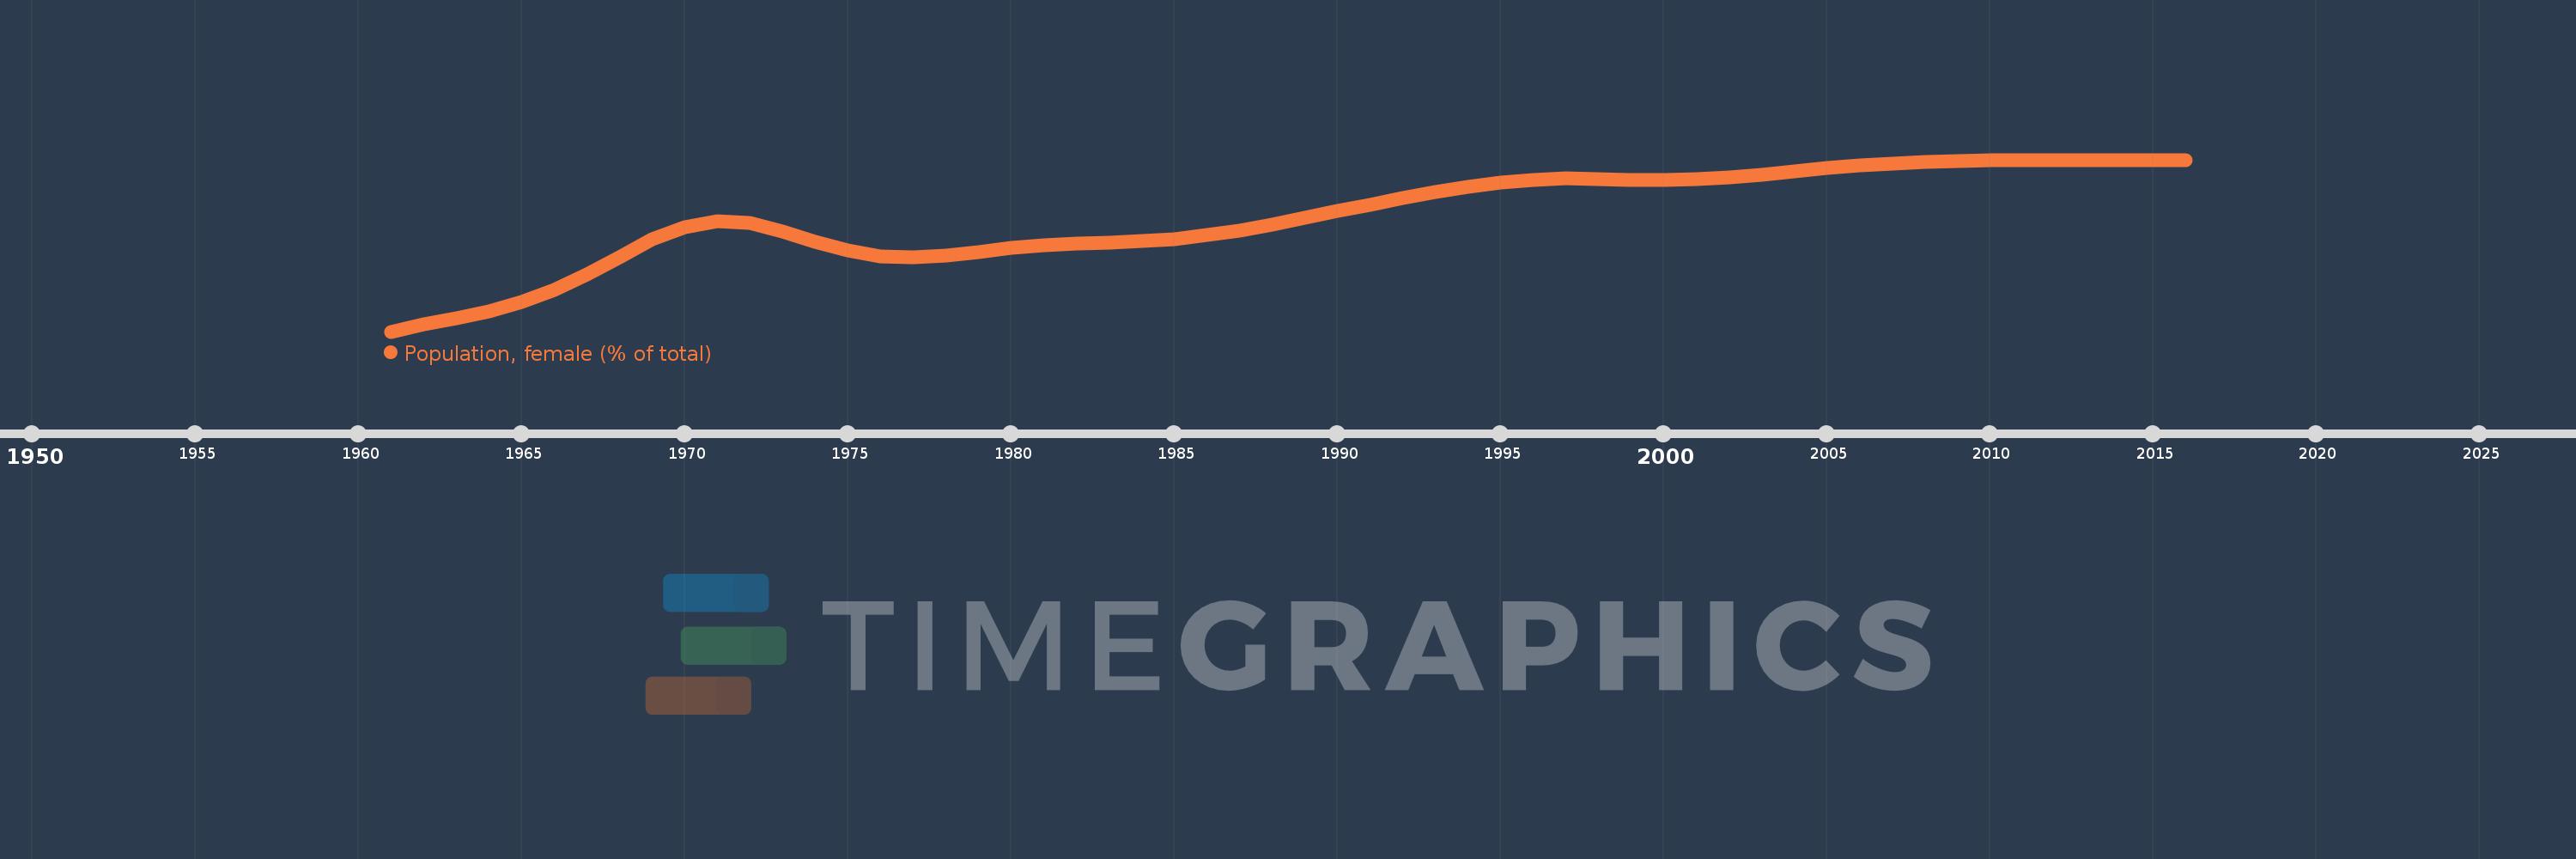
Population, female (% of total)
2016,2015,2014,2013,2012,2011,2010,2009,2008,2007,2006,2005,2004,2003,2002,2001,2000,1999,1998,1997,1996,1995,1994,1993,1992,1991,1990,1989,1988,1987,1986,1985,1984,1983,1982,1981,1980,1979,1978,1977,1976,1975,1974,1973,1972,1971,1970,1969,1968,1967,1966,1965,1964,1963,1962,1961
This statistics in other country:
AfghanistanAlbaniaAlgeriaAngolaAntigua and BarbudaArab WorldArgentinaArmeniaArubaAustraliaAustriaAzerbaijanBahamas, TheBahrainBangladeshBarbadosBelarusBelgiumBelizeBeninBhutanBoliviaBosnia and HerzegovinaBotswanaBrazilBrunei DarussalamBulgariaBurkina FasoBurundiCabo VerdeCambodiaCameroonCanadaCaribbean small statesCentral African RepublicCentral Europe and the BalticsChadChannel IslandsChileChinaColombiaComorosCongo, Dem. Rep.Congo, Rep.Costa RicaCote d'IvoireCroatiaCubaCuracaoCyprusCzech RepublicDenmarkDjiboutiDominican RepublicEarly-demographic dividendEast Asia & PacificEast Asia & Pacific (excluding high income)East Asia & Pacific (IDA & IBRD countries)EcuadorEgypt, Arab Rep.El SalvadorEquatorial GuineaEritreaEstoniaEthiopiaEuro areaEurope & Central AsiaEurope & Central Asia (excluding high income)Europe & Central Asia (IDA & IBRD countries)European UnionFijiFinlandFragile and conflict affected situationsFranceFrench PolynesiaGabonGambia, TheGeorgiaGermanyGhanaGreeceGrenadaGuamGuatemalaGuineaGuinea-BissauGuyanaHaitiHeavily indebted poor countries (HIPC)High incomeHondurasHong Kong SAR, ChinaHungaryIBRD onlyIcelandIDA & IBRD totalIDA blendIDA onlyIDA totalIndiaIndonesiaIran, Islamic Rep.IraqIrelandIsraelItalyJamaicaJapanJordanKazakhstanKenyaKiribatiKorea, Dem. People’s Rep.Korea, Rep.KosovoKuwaitKyrgyz RepublicLao PDRLate-demographic dividendLatin America & Caribbean Latin America & Caribbean (excluding high income)Latin America & the Caribbean (IDA & IBRD countries)LatviaLeast developed countries: UN classificationLebanonLesothoLiberiaLibyaLithuaniaLow & middle incomeLow incomeLower middle incomeLuxembourgMacao SAR, ChinaMacedonia, FYRMadagascarMalawiMalaysiaMaldivesMaliMaltaMauritaniaMauritiusMexicoMicronesia, Fed. Sts.Middle East & North AfricaMiddle East & North Africa (excluding high income)Middle East & North Africa (IDA & IBRD countries)Middle incomeMoldovaMongoliaMontenegroMoroccoMozambiqueMyanmarNamibiaNepalNetherlandsNew CaledoniaNew ZealandNicaraguaNigerNigeriaNorth AmericaNorwayOECD membersOmanOther small statesPacific island small statesPakistanPanamaPapua New GuineaParaguayPeruPhilippinesPolandPortugalPost-demographic dividendPre-demographic dividendPuerto RicoQatarRomaniaRussian FederationRwandaSamoaSao Tome and PrincipeSaudi ArabiaSenegalSerbiaSeychellesSierra LeoneSingaporeSlovak RepublicSloveniaSmall statesSolomon IslandsSomaliaSouth AfricaSouth AsiaSouth Asia (IDA & IBRD)South SudanSpainSri LankaSt. LuciaSt. Vincent and the GrenadinesSub-Saharan Africa Sub-Saharan Africa (excluding high income)Sub-Saharan Africa (IDA & IBRD countries)SudanSurinameSwazilandSwedenSwitzerlandSyrian Arab RepublicTajikistanTanzaniaThailandTimor-LesteTogoTongaTrinidad and TobagoTunisiaTurkeyTurkmenistanUgandaUkraineUnited Arab EmiratesUnited KingdomUnited StatesUpper middle incomeUruguayUzbekistanVanuatuVenezuela, RBVietnamVirgin Islands (U.S.)West Bank and GazaWorldYemen, Rep.ZambiaZimbabwe Timeline:
This timeline shows a graph from 1961 to 2016 of Maldives. No data until 1960. Number of actual observations by date: 56.
Source name:
World Development Indicators
Source organization:
World Bank staff estimates based on male/female distributions of United Nations Population Division's World Population Prospects.
Categories, topics:
Health
Last updated:
apr 23, 2017
Indicators value changes by year
Minimum:
45.551
jan 1, 1961
Maximum:
49.864
jan 1, 2012
At the date of observation
Value
Absolute change
Change from previous value
jan 1, 1961
45.551
+45.551
0.0%
jan 1, 1962
45.728
+0.177
0.39%
jan 1, 1963
45.889
+0.162
0.35%
jan 1, 1964
46.065
+0.176
0.38%
jan 1, 1965
46.292
+0.227
0.49%
jan 1, 1966
46.59
+0.298
0.64%
jan 1, 1967
46.977
+0.387
0.83%
jan 1, 1968
47.426
+0.449
0.96%
jan 1, 1969
47.859
+0.434
0.91%
jan 1, 1970
48.178
+0.318
0.67%
jan 1, 1971
48.321
+0.143
0.3%
jan 1, 1972
48.271
-0.051
-0.1%
jan 1, 1973
48.074
-0.196
-0.41%
jan 1, 1974
47.811
-0.263
-0.55%
jan 1, 1975
47.58
-0.231
-0.48%
jan 1, 1976
47.442
-0.138
-0.29%
jan 1, 1977
47.409
-0.033
-0.07%
jan 1, 1978
47.455
+0.046
0.1%
jan 1, 1979
47.549
+0.093
0.2%
jan 1, 1980
47.645
+0.097
0.2%
jan 1, 1981
47.718
+0.073
0.15%
jan 1, 1982
47.761
+0.043
0.09%
jan 1, 1983
47.79
+0.029
0.06%
jan 1, 1984
47.821
+0.031
0.07%
jan 1, 1985
47.875
+0.055
0.11%
jan 1, 1986
47.967
+0.091
0.19%
jan 1, 1987
48.092
+0.126
0.26%
jan 1, 1988
48.242
+0.15
0.31%
jan 1, 1989
48.407
+0.165
0.34%
jan 1, 1990
48.575
+0.168
0.35%
jan 1, 1991
48.738
+0.163
0.34%
jan 1, 1992
48.897
+0.159
0.33%
jan 1, 1993
49.052
+0.155
0.32%
jan 1, 1994
49.19
+0.138
0.28%
jan 1, 1995
49.298
+0.108
0.22%
jan 1, 1996
49.368
+0.07
0.14%
jan 1, 1997
49.396
+0.027
0.06%
jan 1, 1998
49.389
-0.007
-0.01%
jan 1, 1999
49.367
-0.022
-0.04%
jan 1, 2000
49.356
-0.011
-0.02%
jan 1, 2001
49.372
+0.016
0.03%
jan 1, 2002
49.42
+0.048
0.1%
jan 1, 2003
49.491
+0.071
0.14%
jan 1, 2004
49.575
+0.084
0.17%
jan 1, 2005
49.655
+0.08
0.16%
jan 1, 2006
49.72
+0.065
0.13%
jan 1, 2007
49.769
+0.049
0.1%
jan 1, 2008
49.805
+0.036
0.07%
jan 1, 2009
49.831
+0.025
0.05%
jan 1, 2010
49.847
+0.017
0.03%
jan 1, 2011
49.859
+0.011
0.02%
jan 1, 2012
49.864
+0.005
0.01%
jan 1, 2013
49.863
-0.001
0.0%
jan 1, 2014
49.858
-0.004
-0.01%
jan 1, 2015
49.854
-0.004
-0.01%
jan 1, 2016
49.852
-0.002
0.0%
Ranking of countries by current statistics by years


Comments: