29
/
en
AIzaSyAYiBZKx7MnpbEhh9jyipgxe19OcubqV5w
April 1, 2024
187141
Malawi
MWI
true
2
1
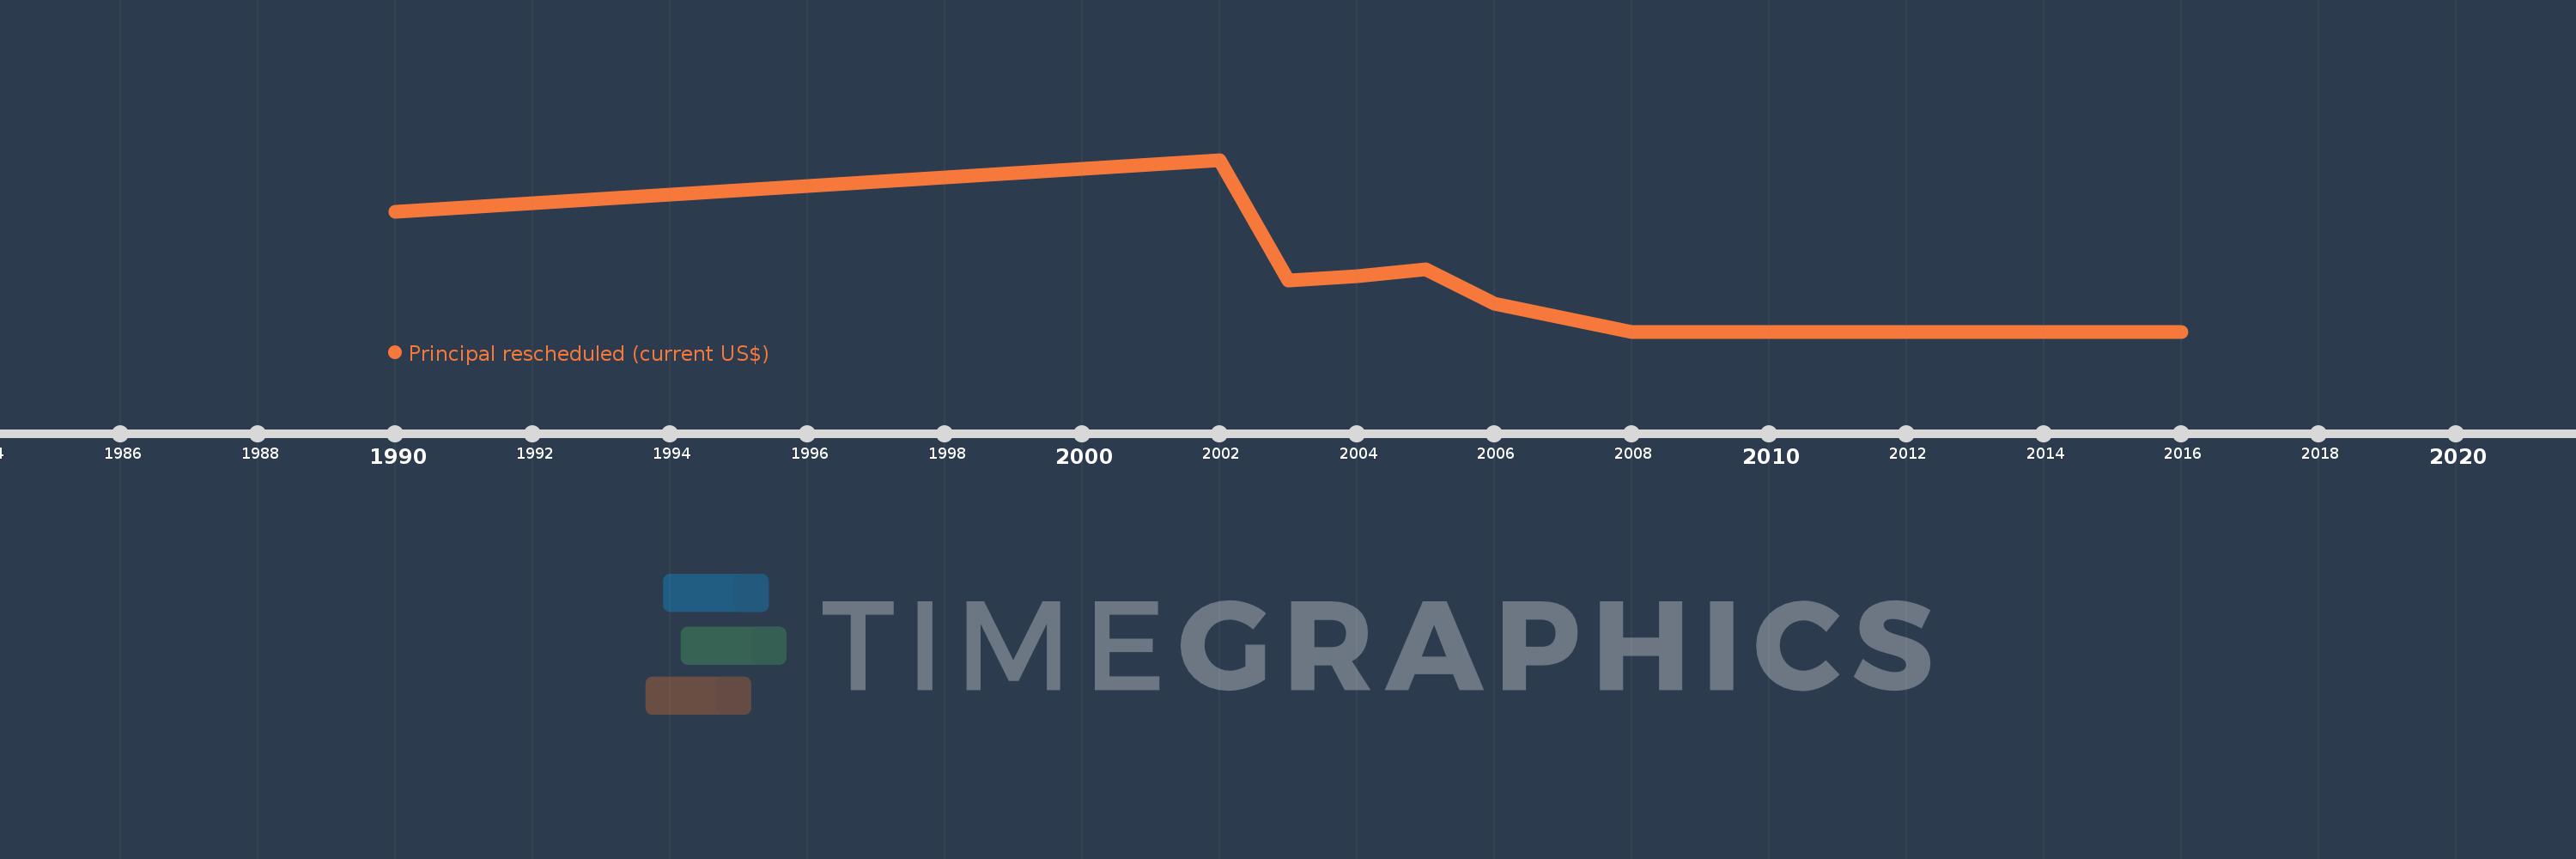
Principal rescheduled (current US$)
2016,2015,2014,2013,2012,2010,2009,2008,2006,2005,2004,2003,2002,1990
This statistics in other country:
Timeline:
This timeline shows a graph from 1990 to 2016 of Malawi. No data until 1989. Number of actual observations by date: 14.
Source name:
World Development Indicators
Source organization:
World Bank, International Debt Statistics.
Categories, topics:
External Debt
Last updated:
apr 23, 2017
Indicators value changes by year
Maximum:
5.986 mln
jan 1, 2002
At the date of observation
Value
Absolute change
Change from previous value
jan 1, 1990
4.166 mln
+4.166 mln
0.0%
jan 1, 2002
5.986 mln
+1.82 mln
43.69%
jan 1, 2003
1.778 mln
-4.208 mln
-70.3%
jan 1, 2004
1.93 mln
+152.0K
8.55%
jan 1, 2005
2.175 mln
+245.0K
12.69%
jan 1, 2006
968.0K
-1.207 mln
-55.49%
jan 1, 2008
0.0
-968.0K
-100.0%
Ranking of countries by current statistics by years


Comments: