29
/
en
AIzaSyAYiBZKx7MnpbEhh9jyipgxe19OcubqV5w
April 1, 2024
185127
Madagascar
MDG
true
2
1
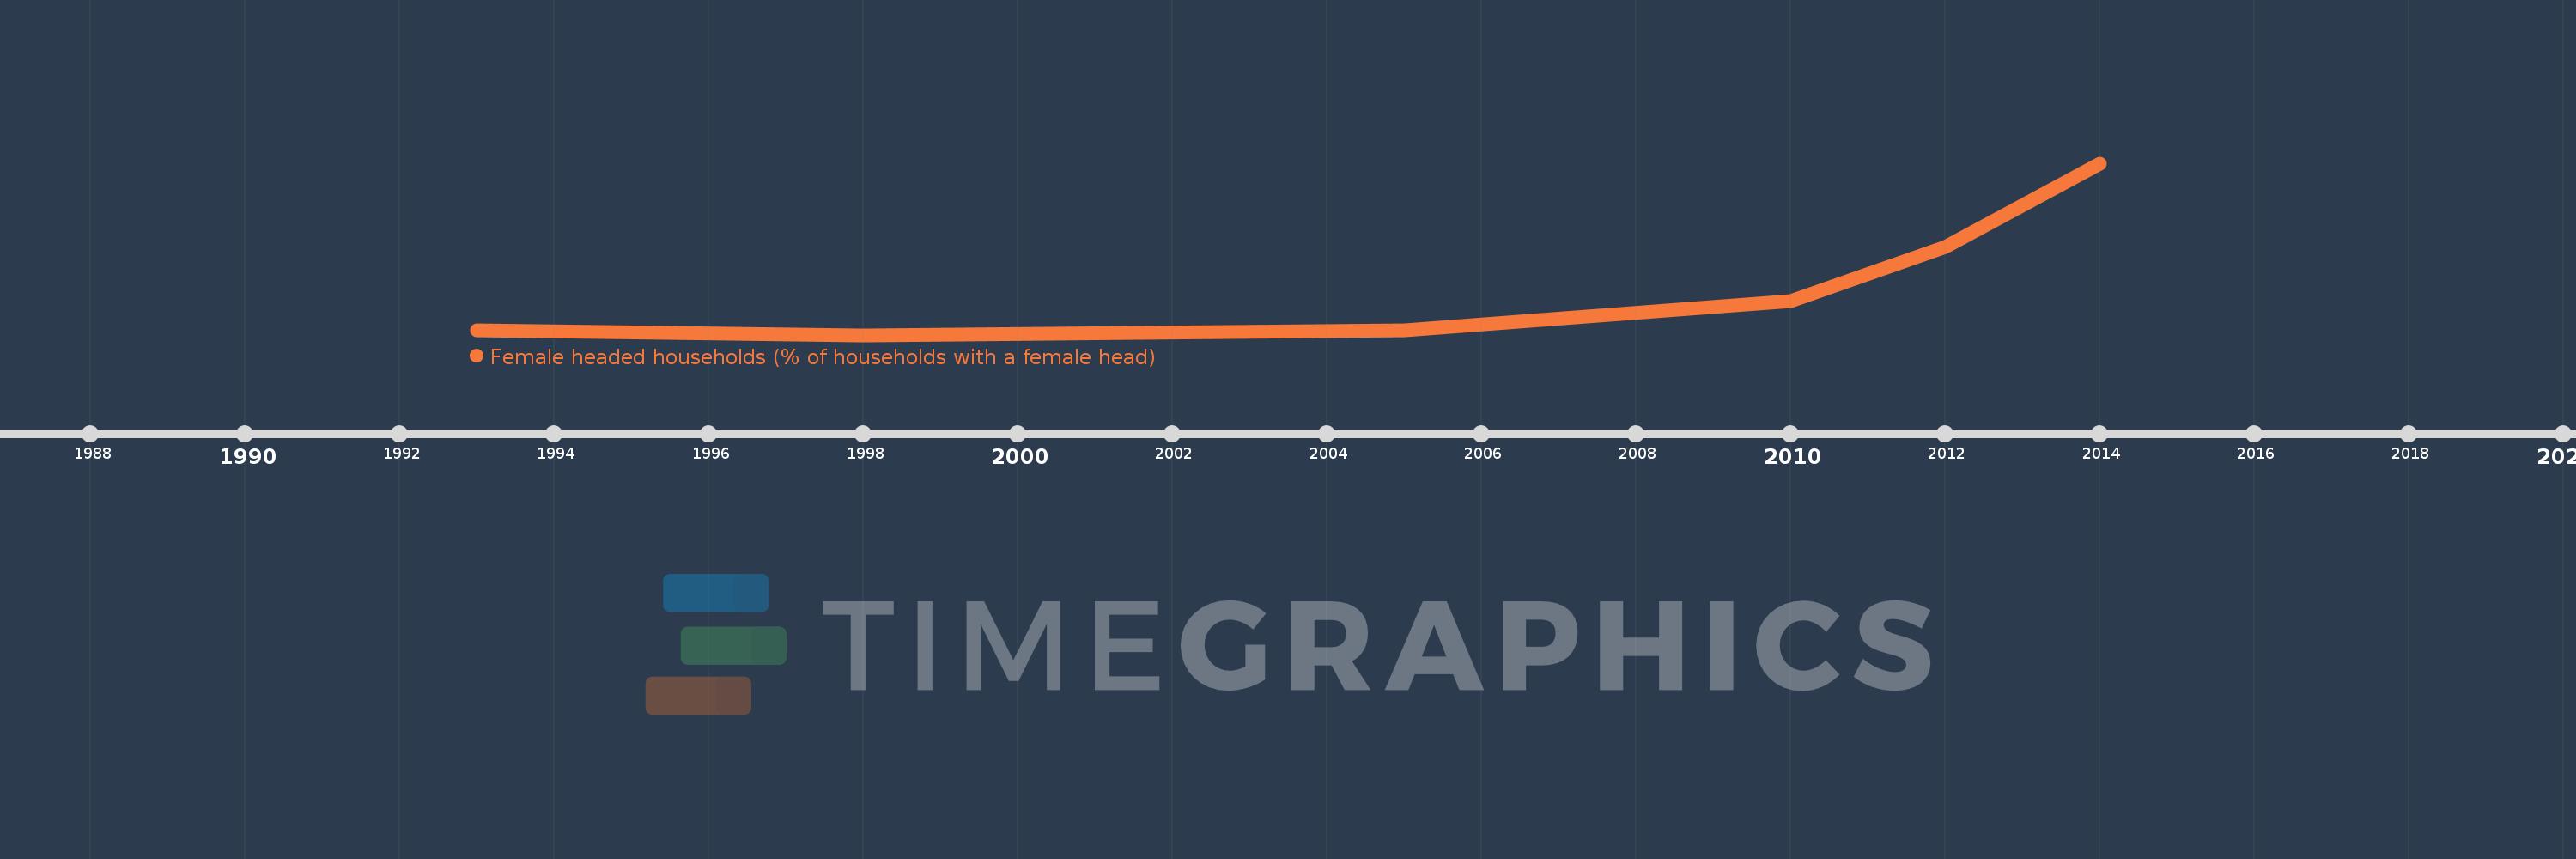
Female headed households (% of households with a female head)
2014,2012,2010,2005,1998,1993
This statistics in other country:
Timeline:
This timeline shows a graph from 1993 to 2014 of Madagascar. No data until 1992. Number of actual observations by date: 6.
Source name:
World Development Indicators
Source organization:
Demographic and Health Surveys.
Categories, topics:
Health, Gender
Last updated:
apr 23, 2017
Indicators value changes by year
At the date of observation
Value
Absolute change
Change from previous value
jan 1, 1993
21.7
+21.7
0.0%
jan 1, 1998
21.6
-0.1
-0.46%
jan 1, 2005
21.7
+0.1
0.46%
jan 1, 2010
22.3
+0.6
2.76%
jan 1, 2012
23.4
+1.1
4.93%
jan 1, 2014
25.1
+1.7
7.26%
Ranking of countries by current statistics by years


Comments: