29
/
en
AIzaSyAYiBZKx7MnpbEhh9jyipgxe19OcubqV5w
April 1, 2024
184140
Macedonia, FYR
MKD
true
2
1
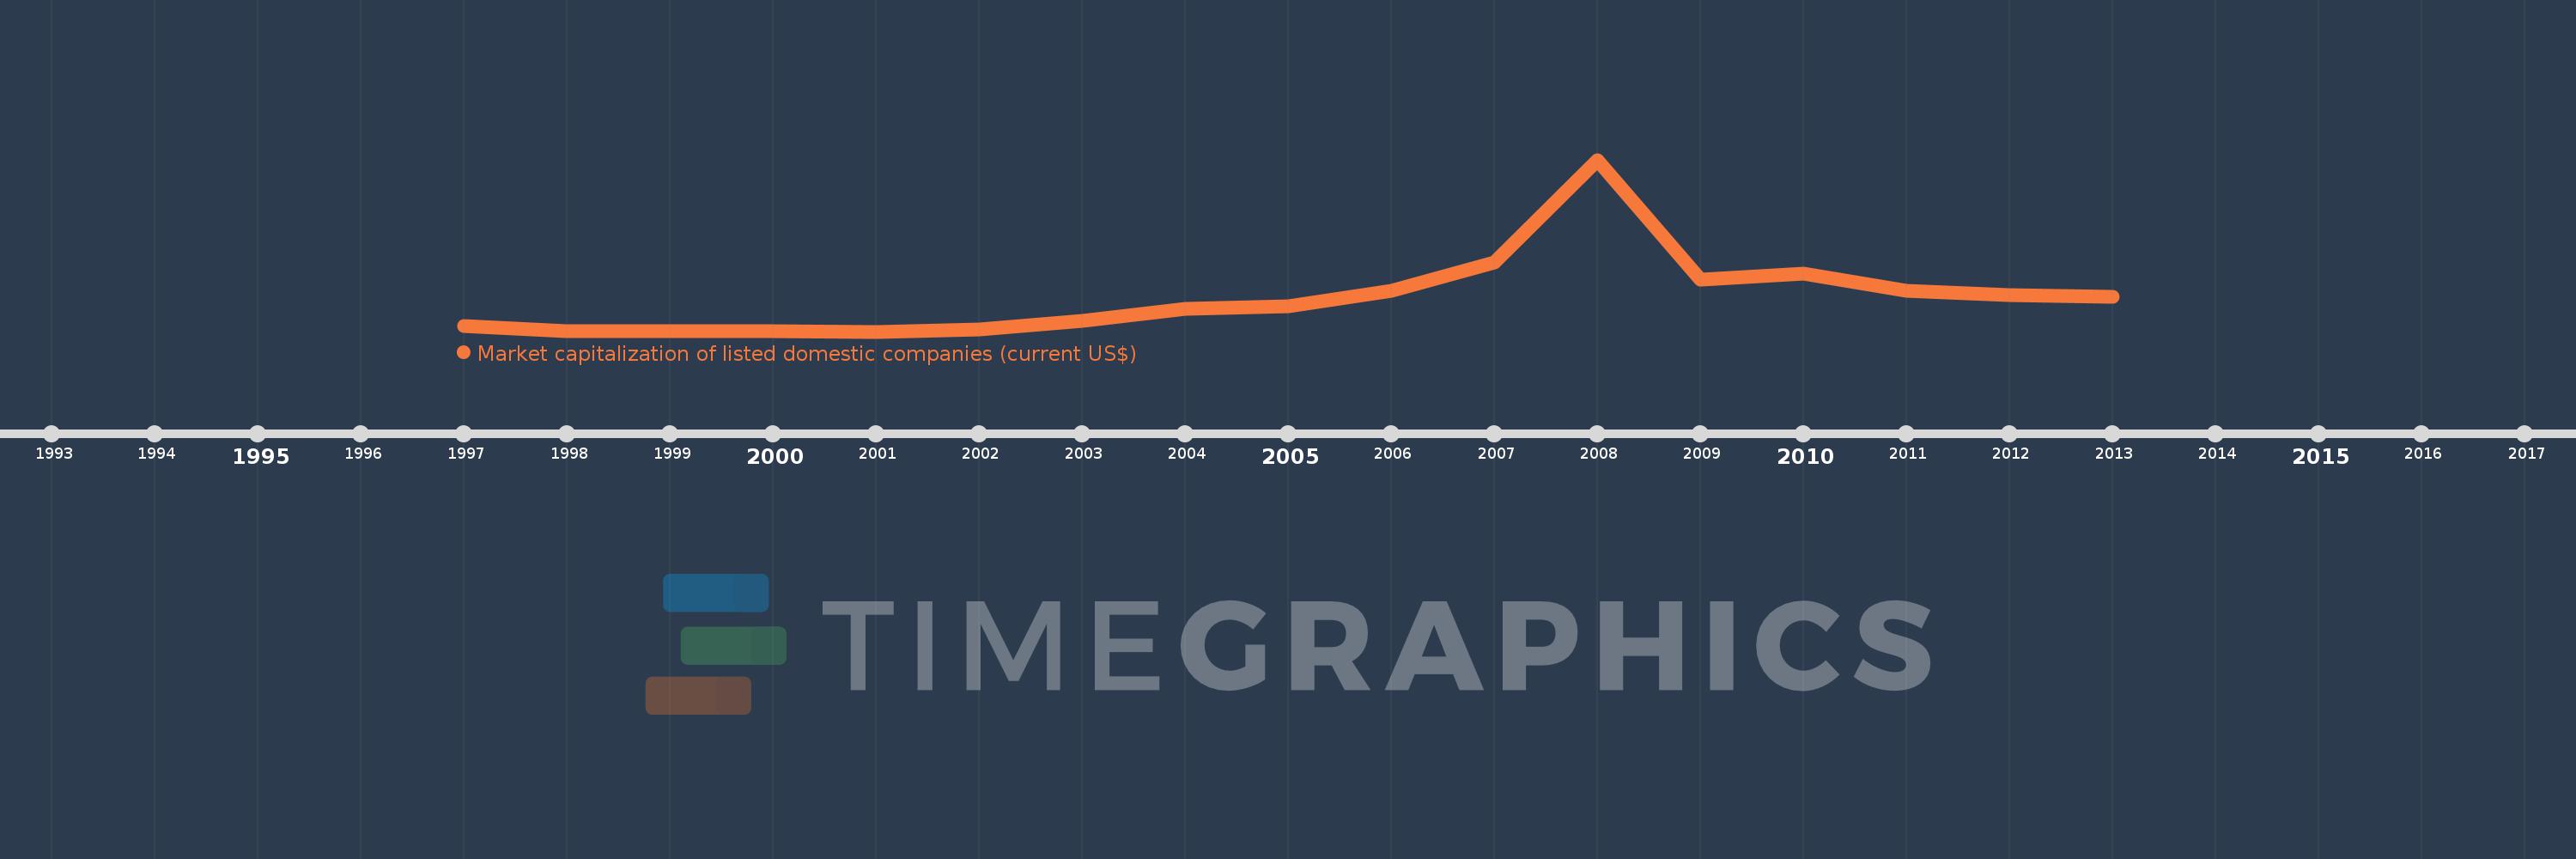
Market capitalization of listed domestic companies (current US$)
2013,2012,2011,2010,2009,2008,2007,2006,2005,2004,2003,2002,2001,2000,1999,1998,1997
This statistics in other country:
Timeline:
This timeline shows a graph from 1997 to 2013 of Macedonia, FYR. No data until 1996. Number of actual observations by date: 17.
Source name:
World Development Indicators
Source organization:
World Federation of Exchanges database.
Categories, topics:
Financial Sector
Last updated:
apr 23, 2017
Indicators value changes by year
Minimum:
7.1 mln
jan 1, 2001
Maximum:
2.715 bln
jan 1, 2008
At the date of observation
Value
Absolute change
Change from previous value
jan 1, 1997
98.0 mln
+98.0 mln
0.0%
jan 1, 1998
8.0 mln
-90.0 mln
-91.84%
jan 1, 1999
8.0 mln
0.0
0.0%
jan 1, 2000
7.673 mln
-326.7K
-4.08%
jan 1, 2001
7.1 mln
-573.3K
-7.47%
jan 1, 2002
46.0 mln
+38.9 mln
547.89%
jan 1, 2003
182.062 mln
+136.062 mln
295.79%
jan 1, 2004
361.68 mln
+179.618 mln
98.66%
jan 1, 2005
413.138 mln
+51.458 mln
14.23%
jan 1, 2006
645.979 mln
+232.841 mln
56.36%
jan 1, 2007
1.098 bln
+452.428 mln
70.04%
jan 1, 2008
2.715 bln
+1.617 bln
147.2%
jan 1, 2009
823.486 mln
-1.892 bln
-69.67%
jan 1, 2010
922.204 mln
+98.719 mln
11.99%
jan 1, 2011
650.214 mln
-271.991 mln
-29.49%
jan 1, 2012
580.357 mln
-69.856 mln
-10.74%
jan 1, 2013
559.06 mln
-21.298 mln
-3.67%
Ranking of countries by current statistics by years


Comments: