29
/
en
AIzaSyAYiBZKx7MnpbEhh9jyipgxe19OcubqV5w
April 1, 2024
181523
Lithuania
LTU
true
2
1
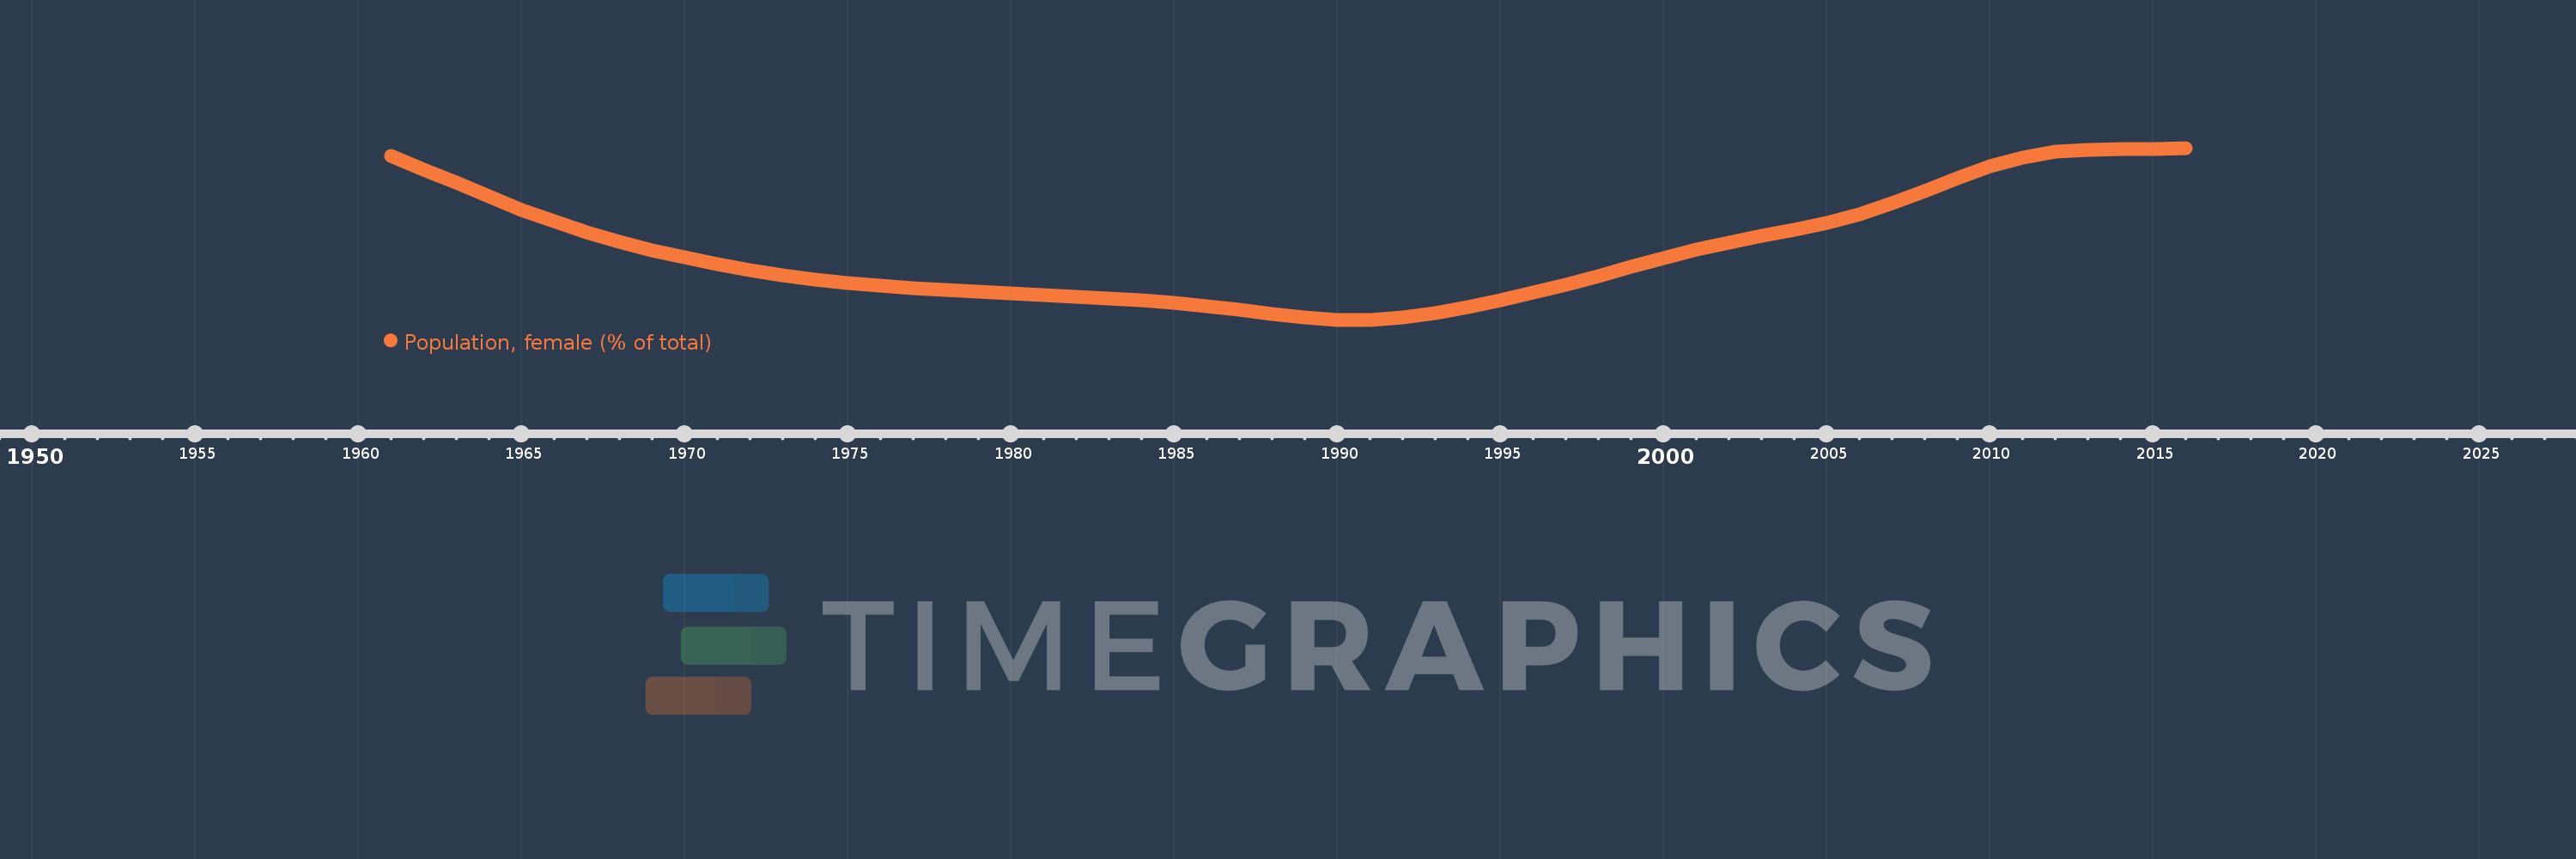
Population, female (% of total)
2016,2015,2014,2013,2012,2011,2010,2009,2008,2007,2006,2005,2004,2003,2002,2001,2000,1999,1998,1997,1996,1995,1994,1993,1992,1991,1990,1989,1988,1987,1986,1985,1984,1983,1982,1981,1980,1979,1978,1977,1976,1975,1974,1973,1972,1971,1970,1969,1968,1967,1966,1965,1964,1963,1962,1961
This statistics in other country:
AfghanistanAlbaniaAlgeriaAngolaAntigua and BarbudaArab WorldArgentinaArmeniaArubaAustraliaAustriaAzerbaijanBahamas, TheBahrainBangladeshBarbadosBelarusBelgiumBelizeBeninBhutanBoliviaBosnia and HerzegovinaBotswanaBrazilBrunei DarussalamBulgariaBurkina FasoBurundiCabo VerdeCambodiaCameroonCanadaCaribbean small statesCentral African RepublicCentral Europe and the BalticsChadChannel IslandsChileChinaColombiaComorosCongo, Dem. Rep.Congo, Rep.Costa RicaCote d'IvoireCroatiaCubaCuracaoCyprusCzech RepublicDenmarkDjiboutiDominican RepublicEarly-demographic dividendEast Asia & PacificEast Asia & Pacific (excluding high income)East Asia & Pacific (IDA & IBRD countries)EcuadorEgypt, Arab Rep.El SalvadorEquatorial GuineaEritreaEstoniaEthiopiaEuro areaEurope & Central AsiaEurope & Central Asia (excluding high income)Europe & Central Asia (IDA & IBRD countries)European UnionFijiFinlandFragile and conflict affected situationsFranceFrench PolynesiaGabonGambia, TheGeorgiaGermanyGhanaGreeceGrenadaGuamGuatemalaGuineaGuinea-BissauGuyanaHaitiHeavily indebted poor countries (HIPC)High incomeHondurasHong Kong SAR, ChinaHungaryIBRD onlyIcelandIDA & IBRD totalIDA blendIDA onlyIDA totalIndiaIndonesiaIran, Islamic Rep.IraqIrelandIsraelItalyJamaicaJapanJordanKazakhstanKenyaKiribatiKorea, Dem. People’s Rep.Korea, Rep.KosovoKuwaitKyrgyz RepublicLao PDRLate-demographic dividendLatin America & Caribbean Latin America & Caribbean (excluding high income)Latin America & the Caribbean (IDA & IBRD countries)LatviaLeast developed countries: UN classificationLebanonLesothoLiberiaLibyaLithuaniaLow & middle incomeLow incomeLower middle incomeLuxembourgMacao SAR, ChinaMacedonia, FYRMadagascarMalawiMalaysiaMaldivesMaliMaltaMauritaniaMauritiusMexicoMicronesia, Fed. Sts.Middle East & North AfricaMiddle East & North Africa (excluding high income)Middle East & North Africa (IDA & IBRD countries)Middle incomeMoldovaMongoliaMontenegroMoroccoMozambiqueMyanmarNamibiaNepalNetherlandsNew CaledoniaNew ZealandNicaraguaNigerNigeriaNorth AmericaNorwayOECD membersOmanOther small statesPacific island small statesPakistanPanamaPapua New GuineaParaguayPeruPhilippinesPolandPortugalPost-demographic dividendPre-demographic dividendPuerto RicoQatarRomaniaRussian FederationRwandaSamoaSao Tome and PrincipeSaudi ArabiaSenegalSerbiaSeychellesSierra LeoneSingaporeSlovak RepublicSloveniaSmall statesSolomon IslandsSomaliaSouth AfricaSouth AsiaSouth Asia (IDA & IBRD)South SudanSpainSri LankaSt. LuciaSt. Vincent and the GrenadinesSub-Saharan Africa Sub-Saharan Africa (excluding high income)Sub-Saharan Africa (IDA & IBRD countries)SudanSurinameSwazilandSwedenSwitzerlandSyrian Arab RepublicTajikistanTanzaniaThailandTimor-LesteTogoTongaTrinidad and TobagoTunisiaTurkeyTurkmenistanUgandaUkraineUnited Arab EmiratesUnited KingdomUnited StatesUpper middle incomeUruguayUzbekistanVanuatuVenezuela, RBVietnamVirgin Islands (U.S.)West Bank and GazaWorldYemen, Rep.ZambiaZimbabwe Timeline:
This timeline shows a graph from 1961 to 2016 of Lithuania. No data until 1960. Number of actual observations by date: 56.
Source name:
World Development Indicators
Source organization:
World Bank staff estimates based on male/female distributions of United Nations Population Division's World Population Prospects.
Categories, topics:
Health
Last updated:
apr 23, 2017
Indicators value changes by year
Minimum:
52.679
jan 1, 1991
Maximum:
53.959
jan 1, 2016
At the date of observation
Value
Absolute change
Change from previous value
jan 1, 1961
53.9
+53.9
0.0%
jan 1, 1962
53.8
-0.099
-0.18%
jan 1, 1963
53.698
-0.103
-0.19%
jan 1, 1964
53.596
-0.102
-0.19%
jan 1, 1965
53.499
-0.097
-0.18%
jan 1, 1966
53.411
-0.088
-0.16%
jan 1, 1967
53.332
-0.079
-0.15%
jan 1, 1968
53.261
-0.071
-0.13%
jan 1, 1969
53.198
-0.063
-0.12%
jan 1, 1970
53.142
-0.056
-0.11%
jan 1, 1971
53.092
-0.05
-0.09%
jan 1, 1972
53.049
-0.043
-0.08%
jan 1, 1973
53.012
-0.037
-0.07%
jan 1, 1974
52.981
-0.031
-0.06%
jan 1, 1975
52.955
-0.026
-0.05%
jan 1, 1976
52.933
-0.022
-0.04%
jan 1, 1977
52.915
-0.018
-0.03%
jan 1, 1978
52.9
-0.015
-0.03%
jan 1, 1979
52.887
-0.013
-0.02%
jan 1, 1980
52.874
-0.012
-0.02%
jan 1, 1981
52.861
-0.013
-0.02%
jan 1, 1982
52.849
-0.013
-0.02%
jan 1, 1983
52.836
-0.013
-0.02%
jan 1, 1984
52.822
-0.014
-0.03%
jan 1, 1985
52.804
-0.018
-0.03%
jan 1, 1986
52.782
-0.022
-0.04%
jan 1, 1987
52.755
-0.027
-0.05%
jan 1, 1988
52.725
-0.03
-0.06%
jan 1, 1989
52.697
-0.028
-0.05%
jan 1, 1990
52.68
-0.017
-0.03%
jan 1, 1991
52.679
-0.001
0.0%
jan 1, 1992
52.695
+0.016
0.03%
jan 1, 1993
52.726
+0.032
0.06%
jan 1, 1994
52.77
+0.044
0.08%
jan 1, 1995
52.823
+0.052
0.1%
jan 1, 1996
52.88
+0.057
0.11%
jan 1, 1997
52.941
+0.061
0.12%
jan 1, 1998
53.006
+0.066
0.12%
jan 1, 1999
53.073
+0.067
0.13%
jan 1, 2000
53.139
+0.066
0.12%
jan 1, 2001
53.201
+0.062
0.12%
jan 1, 2002
53.255
+0.055
0.1%
jan 1, 2003
53.303
+0.048
0.09%
jan 1, 2004
53.349
+0.046
0.09%
jan 1, 2005
53.402
+0.053
0.1%
jan 1, 2006
53.467
+0.065
0.12%
jan 1, 2007
53.547
+0.08
0.15%
jan 1, 2008
53.639
+0.093
0.17%
jan 1, 2009
53.736
+0.096
0.18%
jan 1, 2010
53.822
+0.086
0.16%
jan 1, 2011
53.888
+0.066
0.12%
jan 1, 2012
53.929
+0.041
0.08%
jan 1, 2013
53.947
+0.018
0.03%
jan 1, 2014
53.951
+0.003
0.01%
jan 1, 2015
53.952
+0.001
0.0%
jan 1, 2016
53.959
+0.008
0.01%
Ranking of countries by current statistics by years


Comments: