29
/
en
AIzaSyAYiBZKx7MnpbEhh9jyipgxe19OcubqV5w
April 1, 2024
181388
Lithuania
LTU
true
2
1
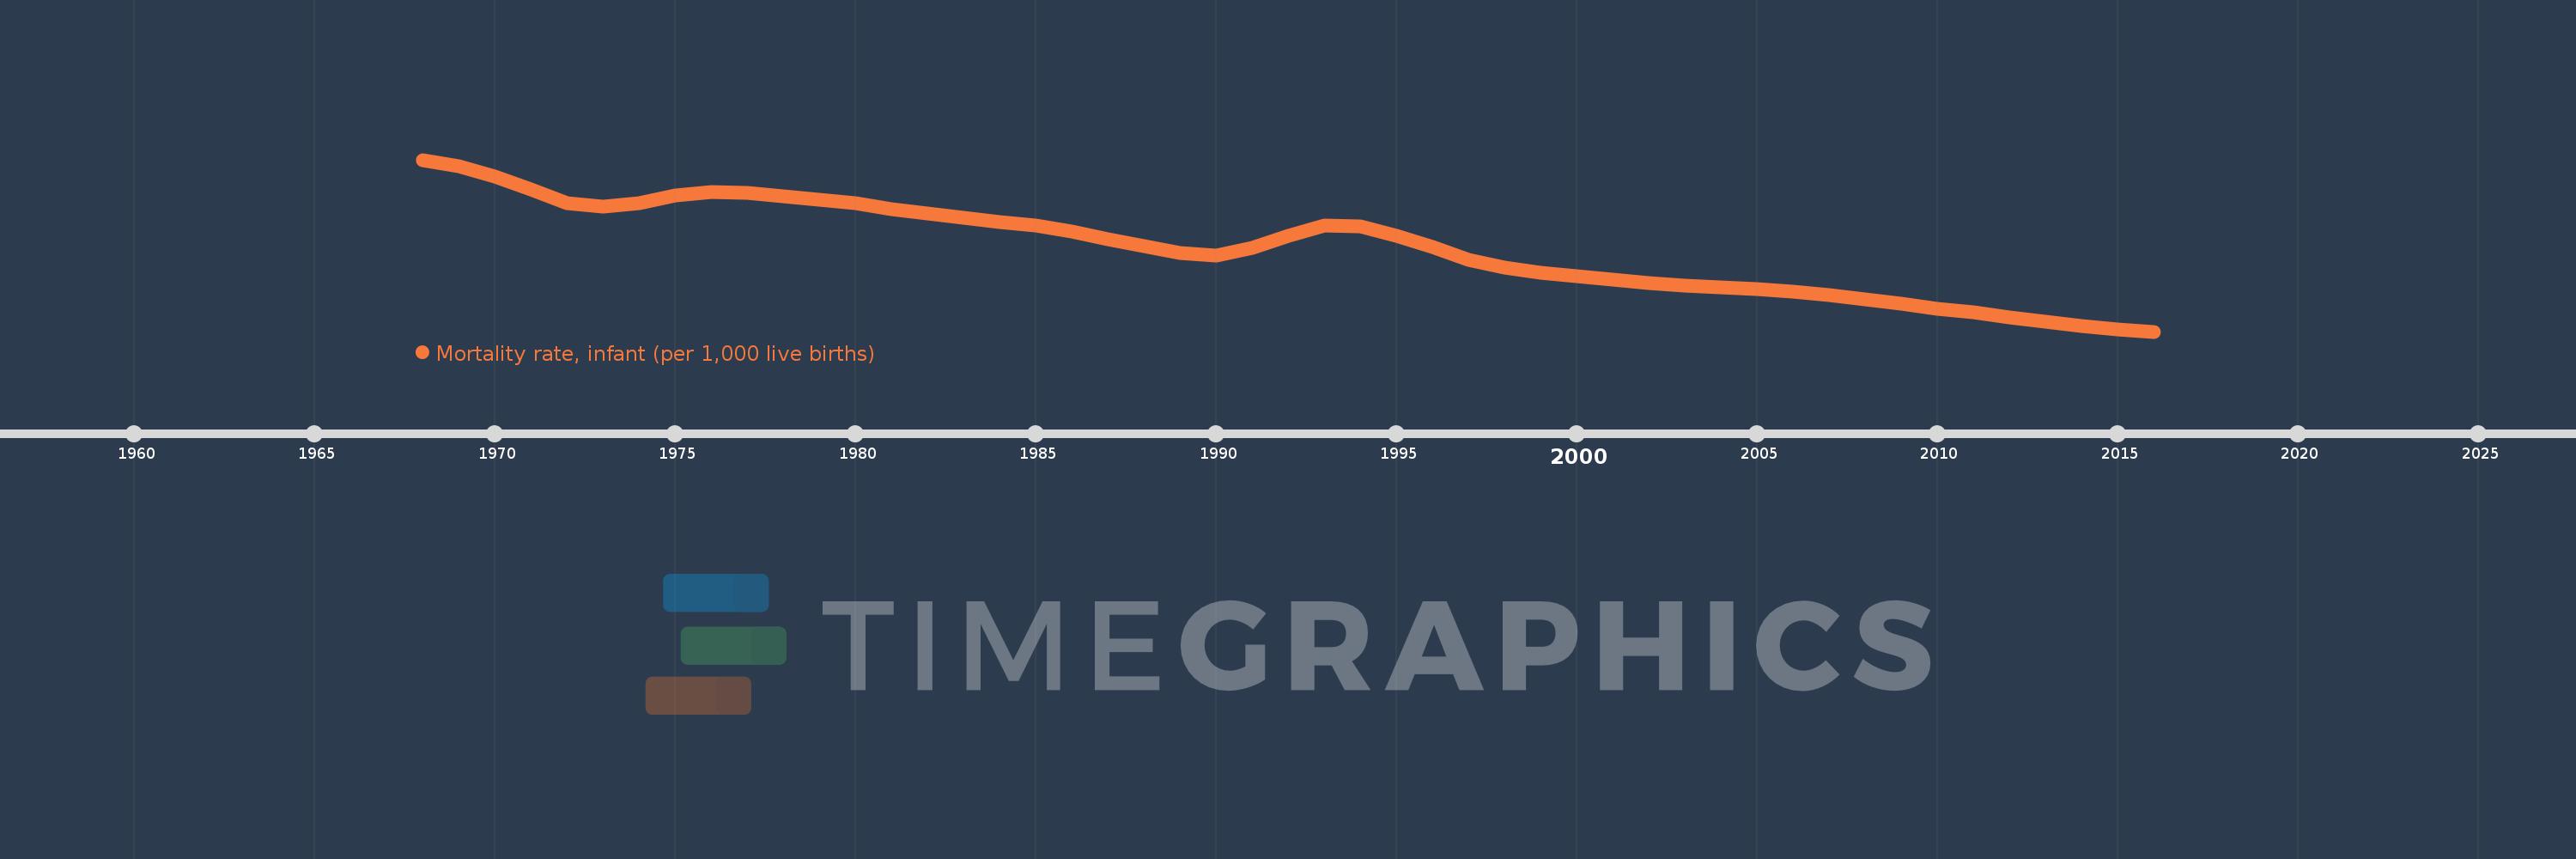
Mortality rate, infant (per 1,000 live births)
2016,2015,2014,2013,2012,2011,2010,2009,2008,2007,2006,2005,2004,2003,2002,2001,2000,1999,1998,1997,1996,1995,1994,1993,1992,1991,1990,1989,1988,1987,1986,1985,1984,1983,1982,1981,1980,1979,1978,1977,1976,1975,1974,1973,1972,1971,1970,1969,1968
This statistics in other country:
AfghanistanAlbaniaAlgeriaAndorraAngolaAntigua and BarbudaArab WorldArgentinaArmeniaAustraliaAustriaAzerbaijanBahamas, TheBahrainBangladeshBarbadosBelarusBelgiumBelizeBeninBhutanBoliviaBosnia and HerzegovinaBotswanaBrazilBrunei DarussalamBulgariaBurkina FasoBurundiCabo VerdeCambodiaCameroonCanadaCaribbean small statesCentral African RepublicCentral Europe and the BalticsChadChileChinaColombiaComorosCongo, Dem. Rep.Congo, Rep.Costa RicaCote d'IvoireCroatiaCubaCyprusCzech RepublicDenmarkDjiboutiDominicaDominican RepublicEarly-demographic dividendEast Asia & PacificEast Asia & Pacific (excluding high income)East Asia & Pacific (IDA & IBRD countries)EcuadorEgypt, Arab Rep.El SalvadorEquatorial GuineaEritreaEstoniaEthiopiaEuro areaEurope & Central AsiaEurope & Central Asia (excluding high income)Europe & Central Asia (IDA & IBRD countries)European UnionFijiFinlandFragile and conflict affected situationsFranceGabonGambia, TheGeorgiaGermanyGhanaGreeceGrenadaGuatemalaGuineaGuinea-BissauGuyanaHaitiHeavily indebted poor countries (HIPC)High incomeHondurasHungaryIBRD onlyIcelandIDA & IBRD totalIDA blendIDA onlyIDA totalIndiaIndonesiaIran, Islamic Rep.IraqIrelandIsraelItalyJamaicaJapanJordanKazakhstanKenyaKiribatiKorea, Dem. People’s Rep.Korea, Rep.KuwaitKyrgyz RepublicLao PDRLate-demographic dividendLatin America & Caribbean Latin America & Caribbean (excluding high income)Latin America & the Caribbean (IDA & IBRD countries)LatviaLeast developed countries: UN classificationLebanonLesothoLiberiaLibyaLithuaniaLow & middle incomeLow incomeLower middle incomeLuxembourgMacedonia, FYRMadagascarMalawiMalaysiaMaldivesMaliMaltaMarshall IslandsMauritaniaMauritiusMexicoMicronesia, Fed. Sts.Middle East & North AfricaMiddle East & North Africa (excluding high income)Middle East & North Africa (IDA & IBRD countries)Middle incomeMoldovaMonacoMongoliaMontenegroMoroccoMozambiqueMyanmarNamibiaNauruNepalNetherlandsNew ZealandNicaraguaNigerNigeriaNorth AmericaNorwayOECD membersOmanOther small statesPacific island small statesPakistanPalauPanamaPapua New GuineaParaguayPeruPhilippinesPolandPortugalPost-demographic dividendPre-demographic dividendQatarRomaniaRussian FederationRwandaSamoaSan MarinoSao Tome and PrincipeSaudi ArabiaSenegalSerbiaSeychellesSierra LeoneSingaporeSlovak RepublicSloveniaSmall statesSolomon IslandsSomaliaSouth AfricaSouth AsiaSouth Asia (IDA & IBRD)South SudanSpainSri LankaSt. Kitts and NevisSt. LuciaSt. Vincent and the GrenadinesSub-Saharan Africa Sub-Saharan Africa (excluding high income)Sub-Saharan Africa (IDA & IBRD countries)SudanSurinameSwazilandSwedenSwitzerlandSyrian Arab RepublicTajikistanTanzaniaThailandTimor-LesteTogoTongaTrinidad and TobagoTunisiaTurkeyTurkmenistanTuvaluUgandaUkraineUnited Arab EmiratesUnited KingdomUnited StatesUpper middle incomeUruguayUzbekistanVanuatuVenezuela, RBVietnamWest Bank and GazaWorldYemen, Rep.ZambiaZimbabwe Timeline:
This timeline shows a graph from 1968 to 2016 of Lithuania. No data until 1967. Number of actual observations by date: 49.
Source name:
World Development Indicators
Source organization:
Estimates Developed by the UN Inter-agency Group for Child Mortality Estimation (UNICEF, WHO, World Bank, UN DESA Population Division) at www.childmortality.org. Projected data are from the United Nations Population Division's World Population Prospects; and may in some cases not be consistent with data before the current year.
Categories, topics:
Health
Last updated:
apr 23, 2017
Indicators value changes by year
At the date of observation
Value
Absolute change
Change from previous value
jan 1, 1968
24.1
+24.1
0.0%
jan 1, 1969
23.3
-0.8
-3.32%
jan 1, 1970
22.1
-1.2
-5.15%
jan 1, 1971
20.5
-1.6
-7.24%
jan 1, 1972
18.9
-1.6
-7.8%
jan 1, 1973
18.4
-0.5
-2.65%
jan 1, 1974
18.9
+0.5
2.72%
jan 1, 1975
19.8
+0.9
4.76%
jan 1, 1976
20.2
+0.4
2.02%
jan 1, 1977
20.1
-0.1
-0.5%
jan 1, 1978
19.7
-0.4
-1.99%
jan 1, 1979
19.3
-0.4
-2.03%
jan 1, 1980
18.8
-0.5
-2.59%
jan 1, 1981
18.1
-0.7
-3.72%
jan 1, 1982
17.6
-0.5
-2.76%
jan 1, 1983
17.1
-0.5
-2.84%
jan 1, 1984
16.6
-0.5
-2.92%
jan 1, 1985
16.1
-0.5
-3.01%
jan 1, 1986
15.4
-0.7
-4.35%
jan 1, 1987
14.5
-0.9
-5.84%
jan 1, 1988
13.6
-0.9
-6.21%
jan 1, 1989
12.8
-0.8
-5.88%
jan 1, 1990
12.5
-0.3
-2.34%
jan 1, 1991
13.4
+0.9
7.2%
jan 1, 1992
14.9
+1.5
11.19%
jan 1, 1993
16.1
+1.2
8.05%
jan 1, 1994
16.0
-0.1
-0.62%
jan 1, 1995
14.9
-1.1
-6.87%
jan 1, 1996
13.5
-1.4
-9.4%
jan 1, 1997
12.0
-1.5
-11.11%
jan 1, 1998
11.0
-1.0
-8.33%
jan 1, 1999
10.4
-0.6
-5.45%
jan 1, 2000
10.0
-0.4
-3.85%
jan 1, 2001
9.6
-0.4
-4.0%
jan 1, 2002
9.2
-0.4
-4.17%
jan 1, 2003
8.9
-0.3
-3.26%
jan 1, 2004
8.7
-0.2
-2.25%
jan 1, 2005
8.4
-0.3
-3.45%
jan 1, 2006
8.1
-0.3
-3.57%
jan 1, 2007
7.7
-0.4
-4.94%
jan 1, 2008
7.2
-0.5
-6.49%
jan 1, 2009
6.7
-0.5
-6.94%
jan 1, 2010
6.1
-0.6
-8.96%
jan 1, 2011
5.6
-0.5
-8.2%
jan 1, 2012
5.0
-0.6
-10.71%
jan 1, 2013
4.5
-0.5
-10.0%
jan 1, 2014
4.0
-0.5
-11.11%
jan 1, 2015
3.6
-0.4
-10.0%
jan 1, 2016
3.3
-0.3
-8.33%
Ranking of countries by current statistics by years


Comments: