29
/
en
AIzaSyAYiBZKx7MnpbEhh9jyipgxe19OcubqV5w
April 1, 2024
180962
Lithuania
LTU
true
2
1
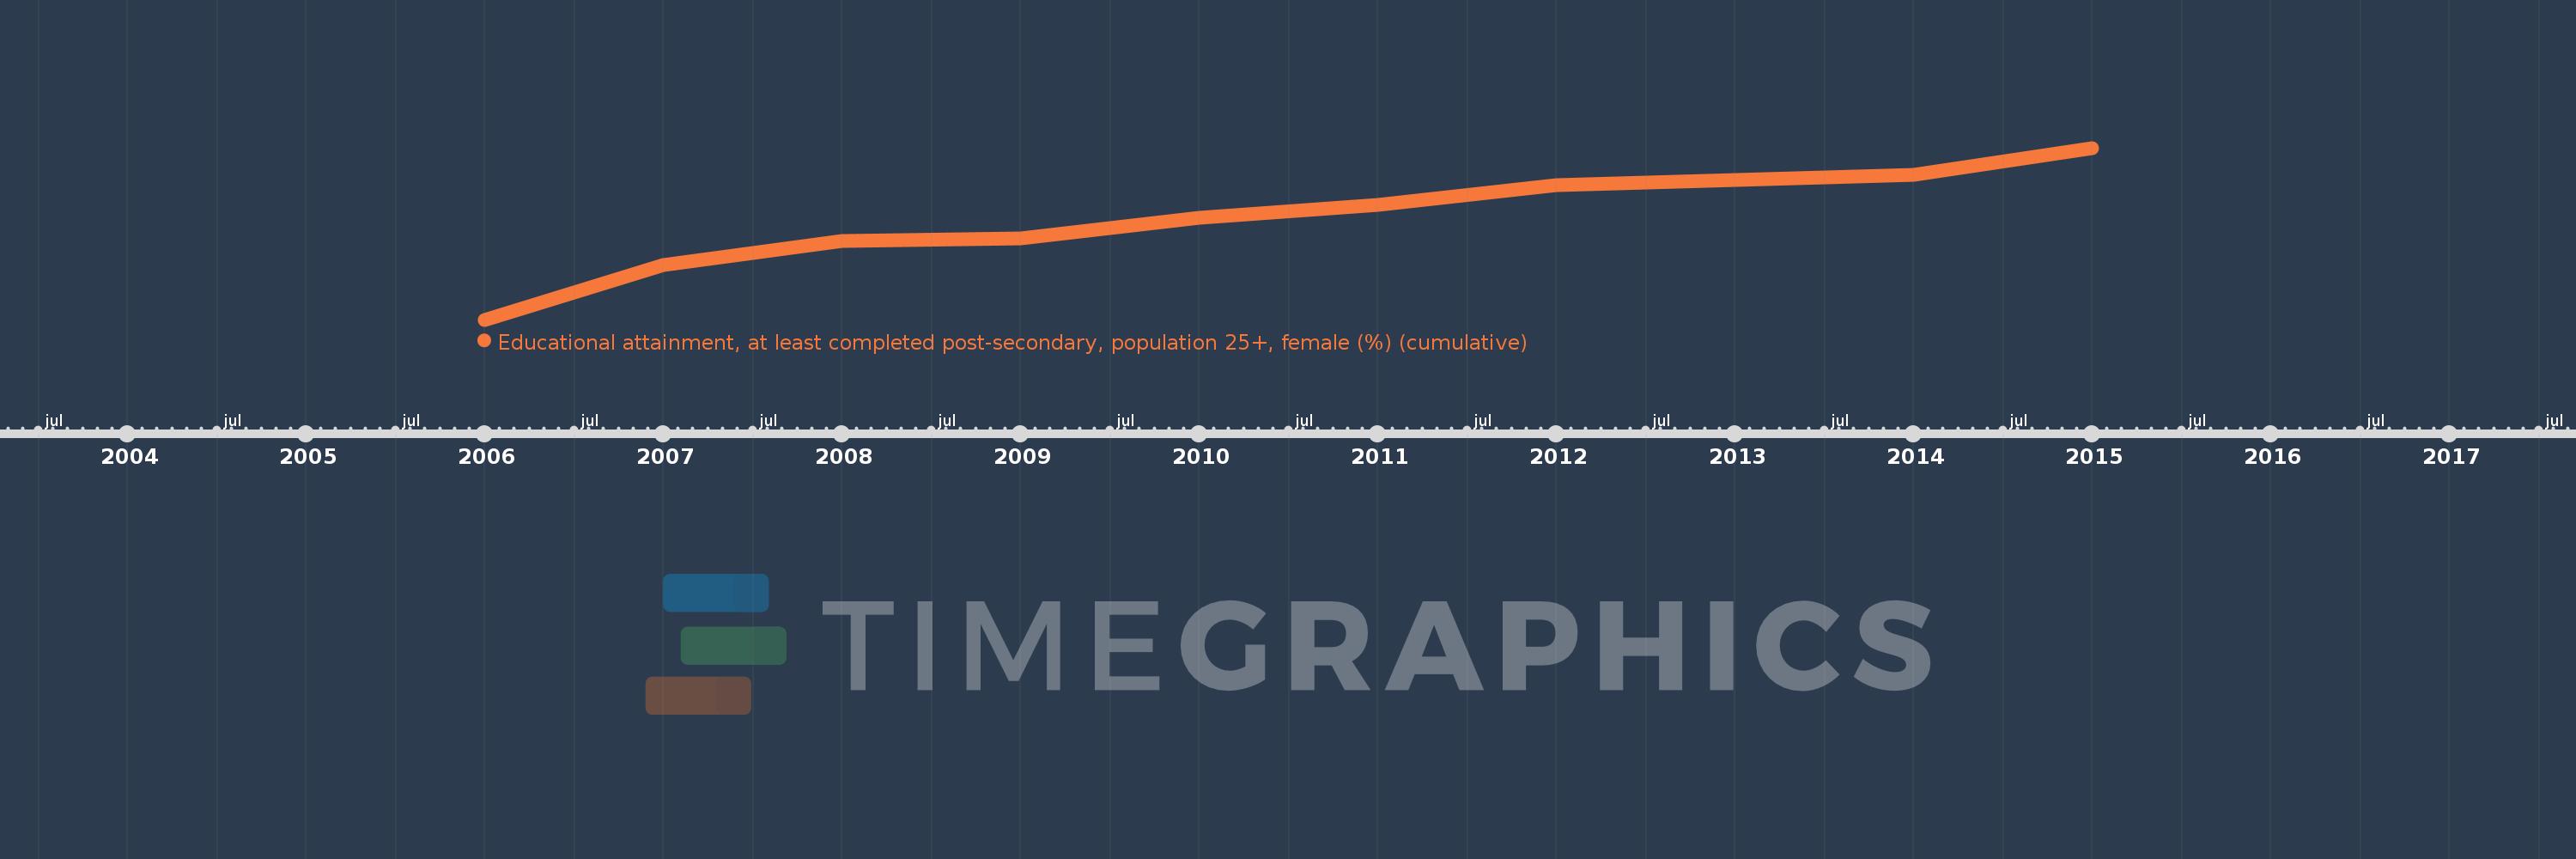
Educational attainment, at least completed post-secondary, population 25+, female (%) (cumulative)
2015,2014,2013,2012,2011,2010,2009,2008,2007,2006
This statistics in other country:
Timeline:
This timeline shows a graph from 2006 to 2015 of Lithuania. No data until 2005. Number of actual observations by date: 10.
Source name:
World Development Indicators
Source organization:
United Nations Educational, Scientific, and Cultural Organization (UNESCO) Institute for Statistics.
Categories, topics:
Education, Gender
Last updated:
apr 23, 2017
Indicators value changes by year
Minimum:
47.415
jan 1, 2006
Maximum:
55.394
jan 1, 2015
At the date of observation
Value
Absolute change
Change from previous value
jan 1, 2006
47.415
+47.415
0.0%
jan 1, 2007
49.957
+2.542
5.36%
jan 1, 2008
51.078
+1.12
2.24%
jan 1, 2009
51.183
+0.105
0.21%
jan 1, 2010
52.167
+0.984
1.92%
jan 1, 2011
52.749
+0.582
1.12%
jan 1, 2012
53.658
+0.91
1.72%
jan 1, 2013
53.9
+0.242
0.45%
jan 1, 2014
54.16
+0.26
0.48%
jan 1, 2015
55.394
+1.234
2.28%
Ranking of countries by current statistics by years


Comments: