29
/
en
AIzaSyAYiBZKx7MnpbEhh9jyipgxe19OcubqV5w
April 1, 2024
179231
Liberia
LBR
true
2
1
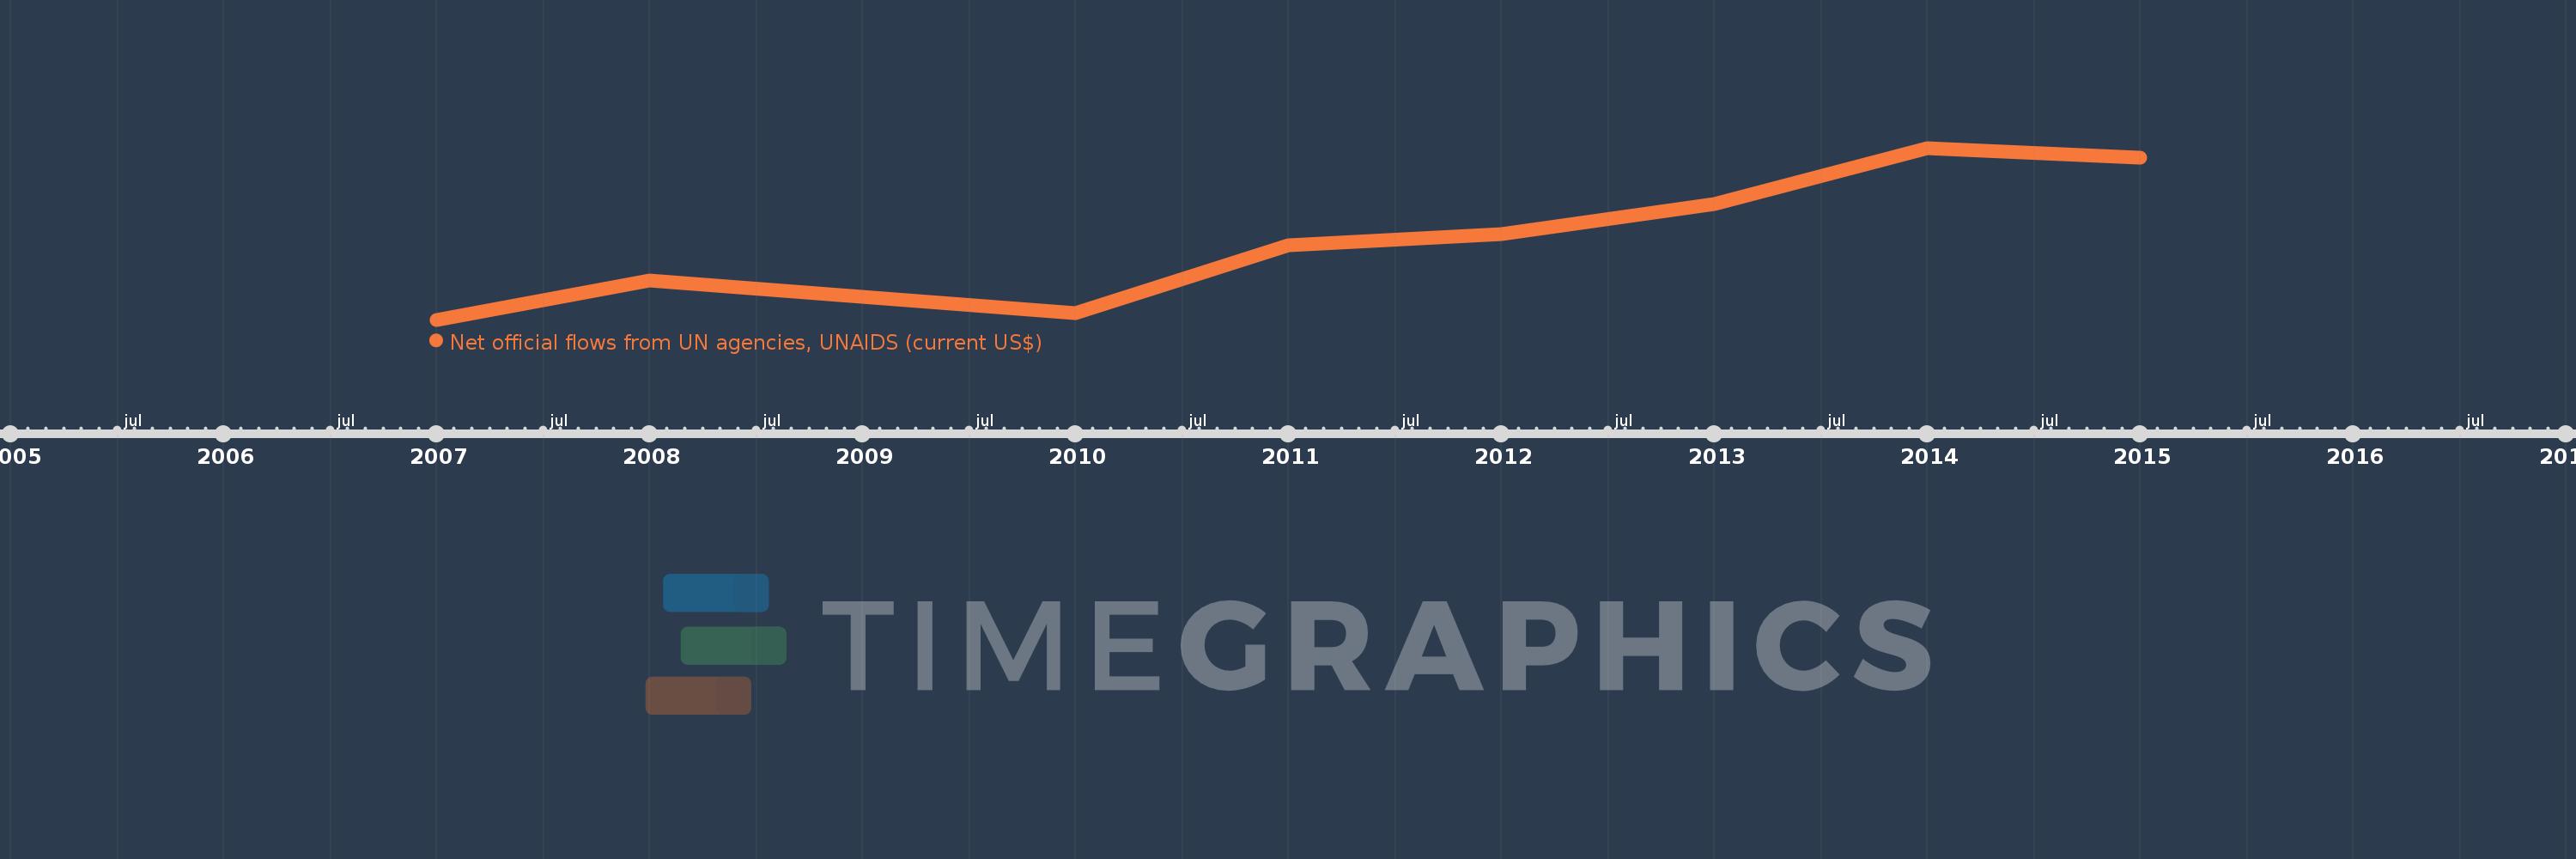
Net official flows from UN agencies, UNAIDS (current US$)
2015,2014,2013,2012,2011,2010,2008,2007
This statistics in other country:
Timeline:
This timeline shows a graph from 2007 to 2015 of Liberia. No data until 2006. Number of actual observations by date: 8.
Source name:
World Development Indicators
Source organization:
Development Assistance Committee of the Organisation for Economic Co-operation and Development, Geographical Distribution of Financial Flows to Developing Countries, Development Co-operation Report, and International Development Statistics database. Data are available online at: www.oecd.org/dac/stats/idsonline.
Categories, topics:
Aid Effectiveness
Last updated:
apr 23, 2017
Indicators value changes by year
Maximum:
750.0K
jan 1, 2014
At the date of observation
Value
Absolute change
Change from previous value
jan 1, 2007
10.0K
+10.0K
0.0%
jan 1, 2008
180.0K
+170.0K
1.7K%
jan 1, 2010
40.0K
-140.0K
-77.78%
jan 1, 2011
330.0K
+290.0K
725.0%
jan 1, 2012
380.0K
+50.0K
15.15%
jan 1, 2013
510.0K
+130.0K
34.21%
jan 1, 2014
750.0K
+240.0K
47.06%
jan 1, 2015
710.0K
-40.0K
-5.33%
Ranking of countries by current statistics by years


Comments: