29
/
en
AIzaSyAYiBZKx7MnpbEhh9jyipgxe19OcubqV5w
April 1, 2024
178102
Lesotho
LSO
true
2
1
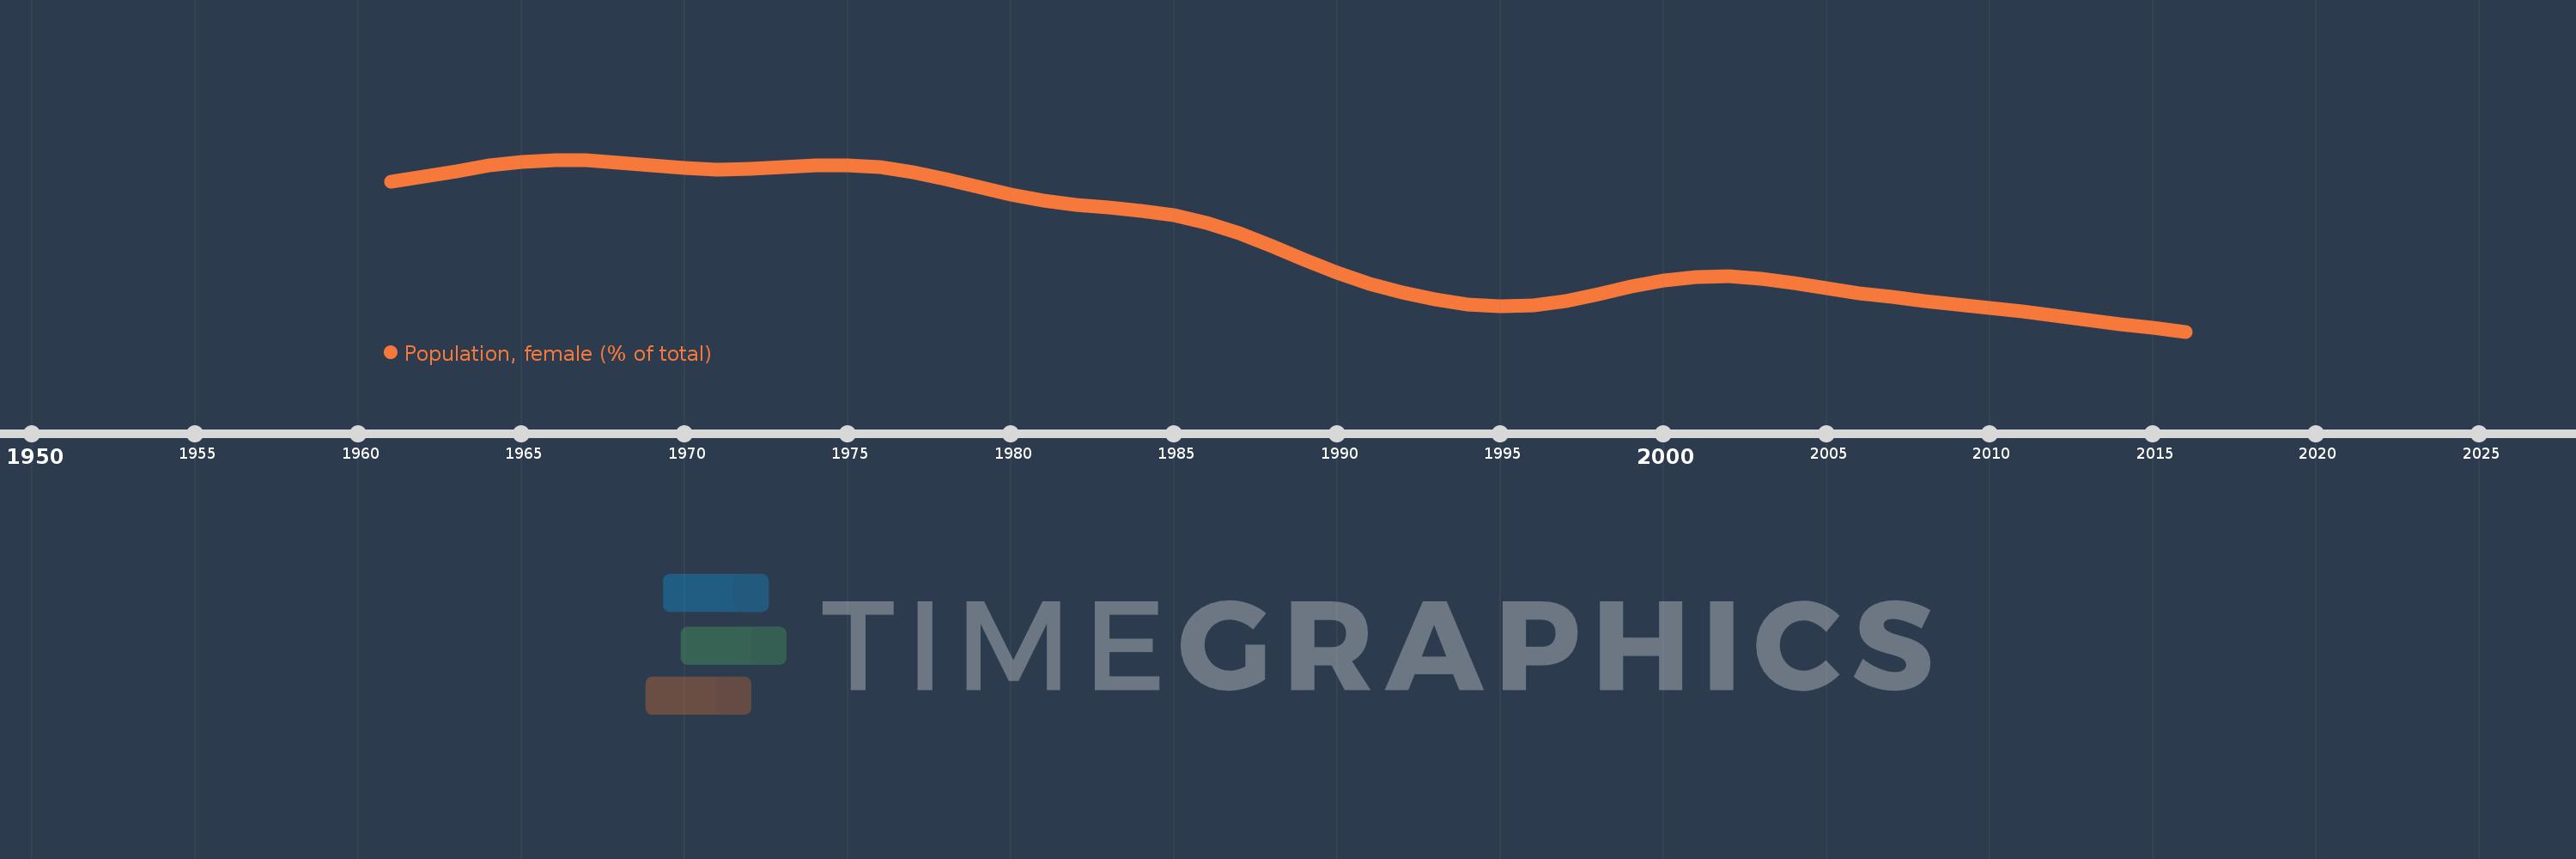
Population, female (% of total)
2016,2015,2014,2013,2012,2011,2010,2009,2008,2007,2006,2005,2004,2003,2002,2001,2000,1999,1998,1997,1996,1995,1994,1993,1992,1991,1990,1989,1988,1987,1986,1985,1984,1983,1982,1981,1980,1979,1978,1977,1976,1975,1974,1973,1972,1971,1970,1969,1968,1967,1966,1965,1964,1963,1962,1961
This statistics in other country:
AfghanistanAlbaniaAlgeriaAngolaAntigua and BarbudaArab WorldArgentinaArmeniaArubaAustraliaAustriaAzerbaijanBahamas, TheBahrainBangladeshBarbadosBelarusBelgiumBelizeBeninBhutanBoliviaBosnia and HerzegovinaBotswanaBrazilBrunei DarussalamBulgariaBurkina FasoBurundiCabo VerdeCambodiaCameroonCanadaCaribbean small statesCentral African RepublicCentral Europe and the BalticsChadChannel IslandsChileChinaColombiaComorosCongo, Dem. Rep.Congo, Rep.Costa RicaCote d'IvoireCroatiaCubaCuracaoCyprusCzech RepublicDenmarkDjiboutiDominican RepublicEarly-demographic dividendEast Asia & PacificEast Asia & Pacific (excluding high income)East Asia & Pacific (IDA & IBRD countries)EcuadorEgypt, Arab Rep.El SalvadorEquatorial GuineaEritreaEstoniaEthiopiaEuro areaEurope & Central AsiaEurope & Central Asia (excluding high income)Europe & Central Asia (IDA & IBRD countries)European UnionFijiFinlandFragile and conflict affected situationsFranceFrench PolynesiaGabonGambia, TheGeorgiaGermanyGhanaGreeceGrenadaGuamGuatemalaGuineaGuinea-BissauGuyanaHaitiHeavily indebted poor countries (HIPC)High incomeHondurasHong Kong SAR, ChinaHungaryIBRD onlyIcelandIDA & IBRD totalIDA blendIDA onlyIDA totalIndiaIndonesiaIran, Islamic Rep.IraqIrelandIsraelItalyJamaicaJapanJordanKazakhstanKenyaKiribatiKorea, Dem. People’s Rep.Korea, Rep.KosovoKuwaitKyrgyz RepublicLao PDRLate-demographic dividendLatin America & Caribbean Latin America & Caribbean (excluding high income)Latin America & the Caribbean (IDA & IBRD countries)LatviaLeast developed countries: UN classificationLebanonLesothoLiberiaLibyaLithuaniaLow & middle incomeLow incomeLower middle incomeLuxembourgMacao SAR, ChinaMacedonia, FYRMadagascarMalawiMalaysiaMaldivesMaliMaltaMauritaniaMauritiusMexicoMicronesia, Fed. Sts.Middle East & North AfricaMiddle East & North Africa (excluding high income)Middle East & North Africa (IDA & IBRD countries)Middle incomeMoldovaMongoliaMontenegroMoroccoMozambiqueMyanmarNamibiaNepalNetherlandsNew CaledoniaNew ZealandNicaraguaNigerNigeriaNorth AmericaNorwayOECD membersOmanOther small statesPacific island small statesPakistanPanamaPapua New GuineaParaguayPeruPhilippinesPolandPortugalPost-demographic dividendPre-demographic dividendPuerto RicoQatarRomaniaRussian FederationRwandaSamoaSao Tome and PrincipeSaudi ArabiaSenegalSerbiaSeychellesSierra LeoneSingaporeSlovak RepublicSloveniaSmall statesSolomon IslandsSomaliaSouth AfricaSouth AsiaSouth Asia (IDA & IBRD)South SudanSpainSri LankaSt. LuciaSt. Vincent and the GrenadinesSub-Saharan Africa Sub-Saharan Africa (excluding high income)Sub-Saharan Africa (IDA & IBRD countries)SudanSurinameSwazilandSwedenSwitzerlandSyrian Arab RepublicTajikistanTanzaniaThailandTimor-LesteTogoTongaTrinidad and TobagoTunisiaTurkeyTurkmenistanUgandaUkraineUnited Arab EmiratesUnited KingdomUnited StatesUpper middle incomeUruguayUzbekistanVanuatuVenezuela, RBVietnamVirgin Islands (U.S.)West Bank and GazaWorldYemen, Rep.ZambiaZimbabwe Timeline:
This timeline shows a graph from 1961 to 2016 of Lesotho. No data until 1960. Number of actual observations by date: 56.
Source name:
World Development Indicators
Source organization:
World Bank staff estimates based on male/female distributions of United Nations Population Division's World Population Prospects.
Categories, topics:
Health
Last updated:
apr 23, 2017
Indicators value changes by year
Minimum:
50.503
jan 1, 2016
Maximum:
53.752
jan 1, 1966
At the date of observation
Value
Absolute change
Change from previous value
jan 1, 1961
53.335
+53.335
0.0%
jan 1, 1962
53.432
+0.097
0.18%
jan 1, 1963
53.539
+0.107
0.2%
jan 1, 1964
53.64
+0.101
0.19%
jan 1, 1965
53.715
+0.075
0.14%
jan 1, 1966
53.752
+0.038
0.07%
jan 1, 1967
53.746
-0.007
-0.01%
jan 1, 1968
53.702
-0.044
-0.08%
jan 1, 1969
53.642
-0.06
-0.11%
jan 1, 1970
53.592
-0.05
-0.09%
jan 1, 1971
53.568
-0.024
-0.04%
jan 1, 1972
53.578
+0.009
0.02%
jan 1, 1973
53.609
+0.031
0.06%
jan 1, 1974
53.641
+0.032
0.06%
jan 1, 1975
53.646
+0.005
0.01%
jan 1, 1976
53.606
-0.04
-0.07%
jan 1, 1977
53.515
-0.091
-0.17%
jan 1, 1978
53.385
-0.13
-0.24%
jan 1, 1979
53.237
-0.148
-0.28%
jan 1, 1980
53.099
-0.139
-0.26%
jan 1, 1981
52.986
-0.113
-0.21%
jan 1, 1982
52.906
-0.08
-0.15%
jan 1, 1983
52.85
-0.057
-0.11%
jan 1, 1984
52.791
-0.058
-0.11%
jan 1, 1985
52.7
-0.092
-0.17%
jan 1, 1986
52.556
-0.143
-0.27%
jan 1, 1987
52.358
-0.199
-0.38%
jan 1, 1988
52.118
-0.24
-0.46%
jan 1, 1989
51.861
-0.257
-0.49%
jan 1, 1990
51.617
-0.244
-0.47%
jan 1, 1991
51.411
-0.206
-0.4%
jan 1, 1992
51.243
-0.168
-0.33%
jan 1, 1993
51.11
-0.133
-0.26%
jan 1, 1994
51.02
-0.09
-0.18%
jan 1, 1995
50.983
-0.037
-0.07%
jan 1, 1996
51.0
+0.017
0.03%
jan 1, 1997
51.078
+0.078
0.15%
jan 1, 1998
51.206
+0.128
0.25%
jan 1, 1999
51.352
+0.146
0.28%
jan 1, 2000
51.473
+0.122
0.24%
jan 1, 2001
51.542
+0.069
0.13%
jan 1, 2002
51.547
+0.005
0.01%
jan 1, 2003
51.5
-0.048
-0.09%
jan 1, 2004
51.415
-0.084
-0.16%
jan 1, 2005
51.32
-0.095
-0.19%
jan 1, 2006
51.233
-0.088
-0.17%
jan 1, 2007
51.157
-0.076
-0.15%
jan 1, 2008
51.086
-0.07
-0.14%
jan 1, 2009
51.019
-0.067
-0.13%
jan 1, 2010
50.951
-0.068
-0.13%
jan 1, 2011
50.878
-0.073
-0.14%
jan 1, 2012
50.802
-0.076
-0.15%
jan 1, 2013
50.725
-0.077
-0.15%
jan 1, 2014
50.648
-0.077
-0.15%
jan 1, 2015
50.574
-0.074
-0.15%
jan 1, 2016
50.503
-0.071
-0.14%
Ranking of countries by current statistics by years


Comments: