29
/
en
AIzaSyAYiBZKx7MnpbEhh9jyipgxe19OcubqV5w
April 1, 2024
175202
Latvia
LVA
true
2
1
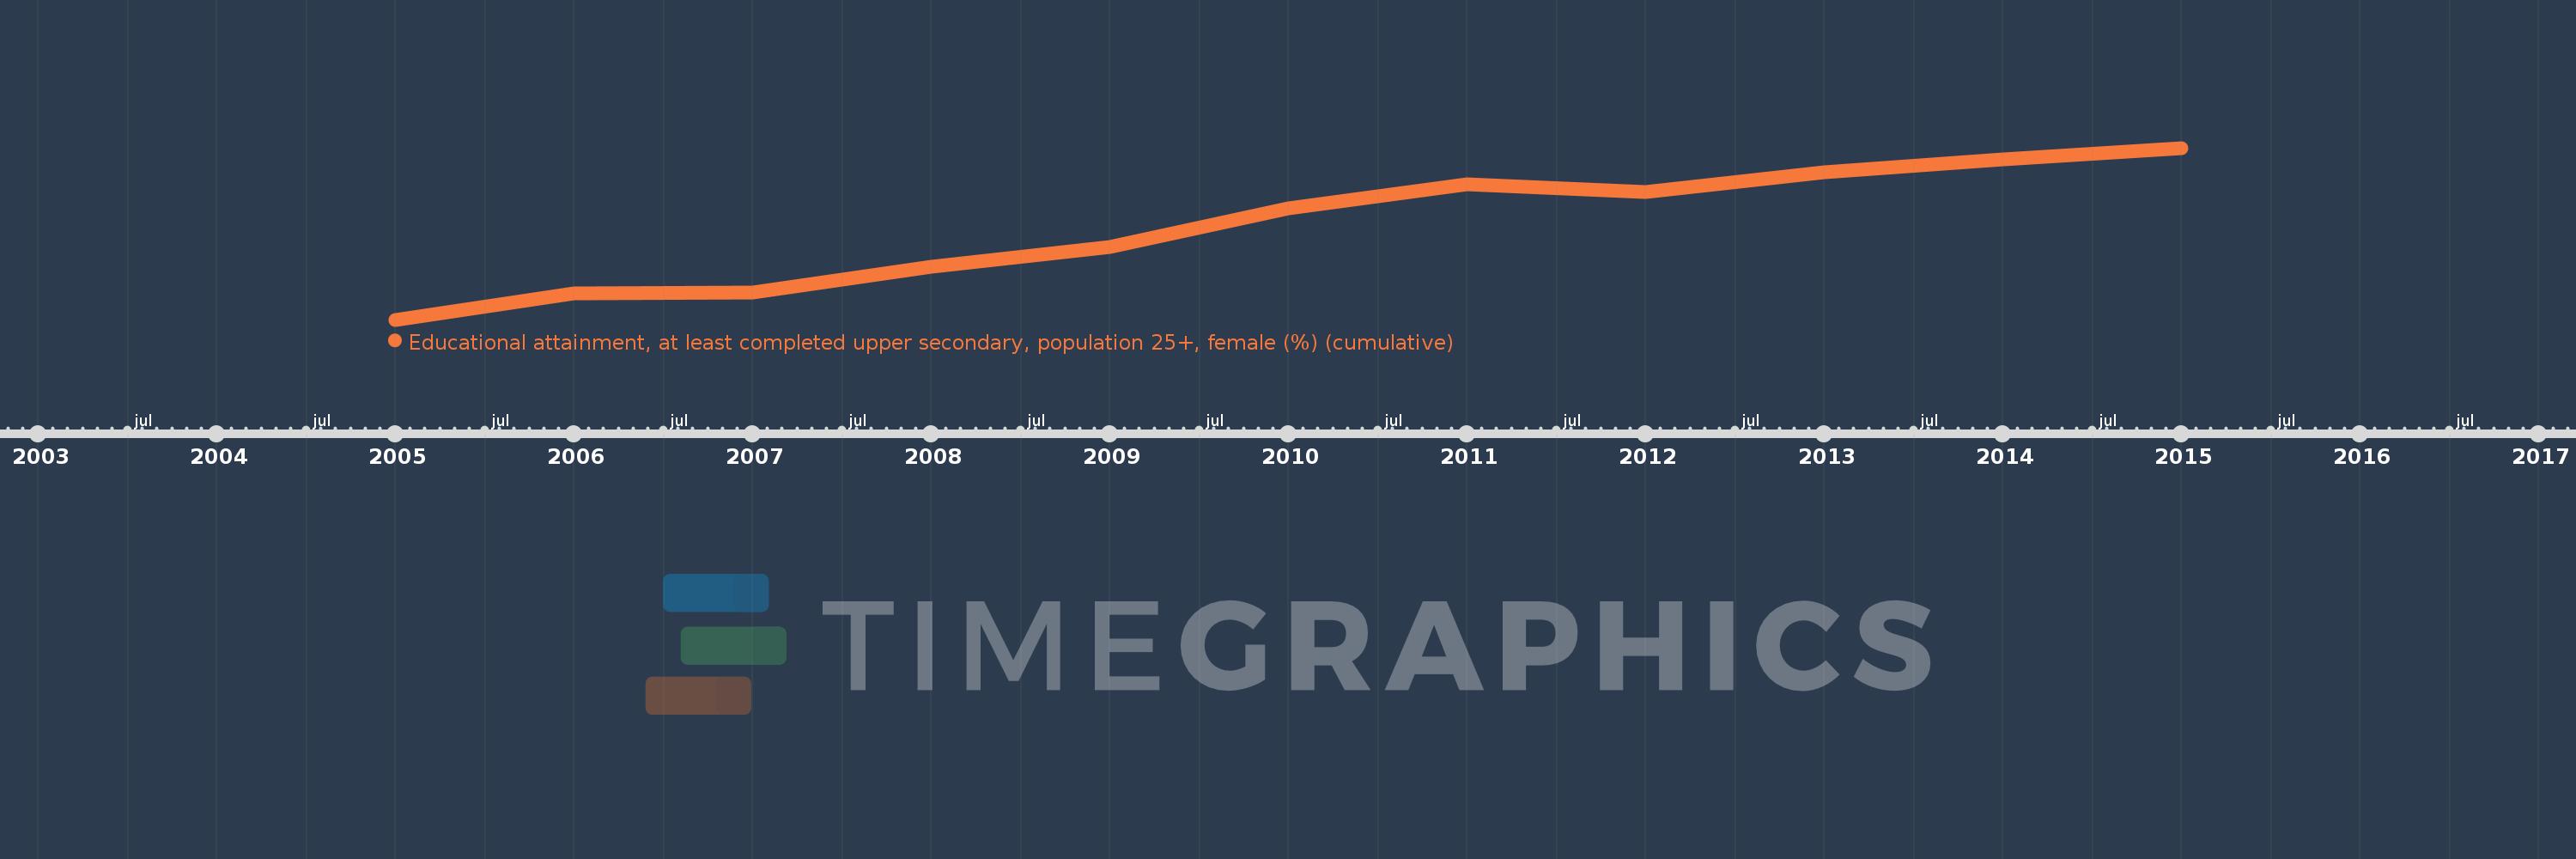
Educational attainment, at least completed upper secondary, population 25+, female (%) (cumulative)
2015,2014,2013,2012,2011,2010,2009,2008,2007,2006,2005
This statistics in other country:
Timeline:
This timeline shows a graph from 2005 to 2015 of Latvia. No data until 2004. Number of actual observations by date: 11.
Source name:
World Development Indicators
Source organization:
United Nations Educational, Scientific, and Cultural Organization (UNESCO) Institute for Statistics.
Categories, topics:
Education, Gender
Last updated:
apr 23, 2017
Indicators value changes by year
Minimum:
80.045
jan 1, 2005
Maximum:
89.975
jan 1, 2015
At the date of observation
Value
Absolute change
Change from previous value
jan 1, 2005
80.045
+80.045
0.0%
jan 1, 2006
81.545
+1.499
1.87%
jan 1, 2007
81.629
+0.084
0.1%
jan 1, 2008
83.099
+1.47
1.8%
jan 1, 2009
84.273
+1.174
1.41%
jan 1, 2010
86.507
+2.234
2.65%
jan 1, 2011
87.866
+1.36
1.57%
jan 1, 2012
87.441
-0.425
-0.48%
jan 1, 2013
88.556
+1.115
1.28%
jan 1, 2014
89.296
+0.74
0.84%
jan 1, 2015
89.975
+0.679
0.76%
Ranking of countries by current statistics by years


Comments: