29
/
en
AIzaSyAYiBZKx7MnpbEhh9jyipgxe19OcubqV5w
April 1, 2024
174509
Lao PDR
LAO
true
2
1
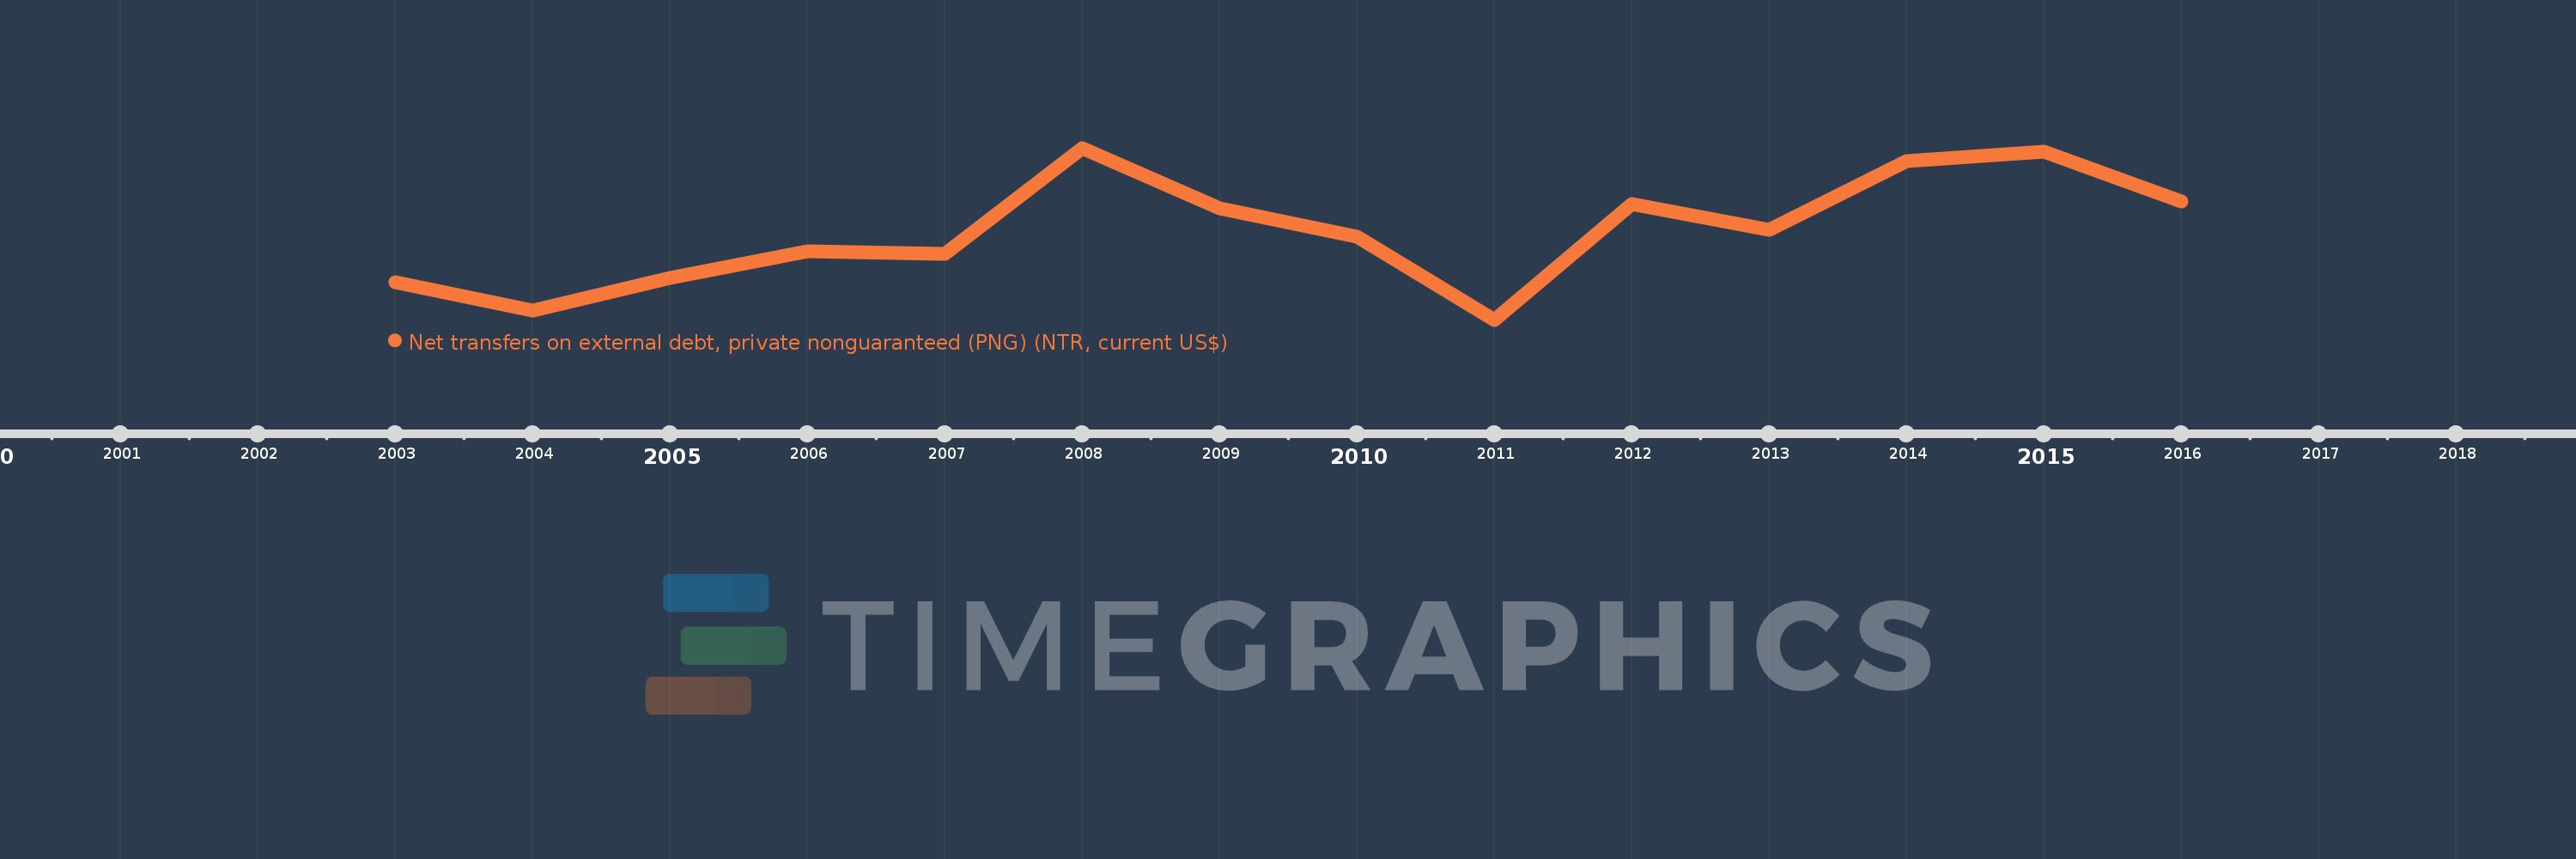
Net transfers on external debt, private nonguaranteed (PNG) (NTR, current US$)
2016,2015,2014,2013,2012,2011,2010,2009,2008,2007,2006,2005,2004,2003
This statistics in other country:
Timeline:
This timeline shows a graph from 2003 to 2016 of Lao PDR. No data until 2002. Number of actual observations by date: 14.
Source name:
World Development Indicators
Source organization:
World Bank, International Debt Statistics.
Categories, topics:
External Debt
Last updated:
apr 23, 2017
Indicators value changes by year
Minimum:
-64.4 mln
jan 1, 2011
Maximum:
720.39 mln
jan 1, 2008
At the date of observation
Value
Absolute change
Change from previous value
jan 1, 2003
106.59 mln
+106.59 mln
0.0%
jan 1, 2004
-22.02 mln
-128.61 mln
-120.66%
jan 1, 2005
127.64 mln
+149.66 mln
-679.65%
jan 1, 2006
248.7 mln
+121.06 mln
94.84%
jan 1, 2007
237.09 mln
-11.61 mln
-4.67%
jan 1, 2008
720.39 mln
+483.3 mln
203.85%
jan 1, 2009
444.779 mln
-275.611 mln
-38.26%
jan 1, 2010
314.42 mln
-130.359 mln
-29.31%
jan 1, 2011
-64.4 mln
-378.82 mln
-120.48%
jan 1, 2012
464.824 mln
+529.224 mln
-821.78%
jan 1, 2013
345.0 mln
-119.824 mln
-25.78%
jan 1, 2014
660.203 mln
+315.203 mln
91.36%
jan 1, 2015
704.532 mln
+44.329 mln
6.71%
jan 1, 2016
476.336 mln
-228.196 mln
-32.39%
Ranking of countries by current statistics by years


Comments: