29
/
en
AIzaSyAYiBZKx7MnpbEhh9jyipgxe19OcubqV5w
April 1, 2024
173807
Lao PDR
LAO
true
2
1
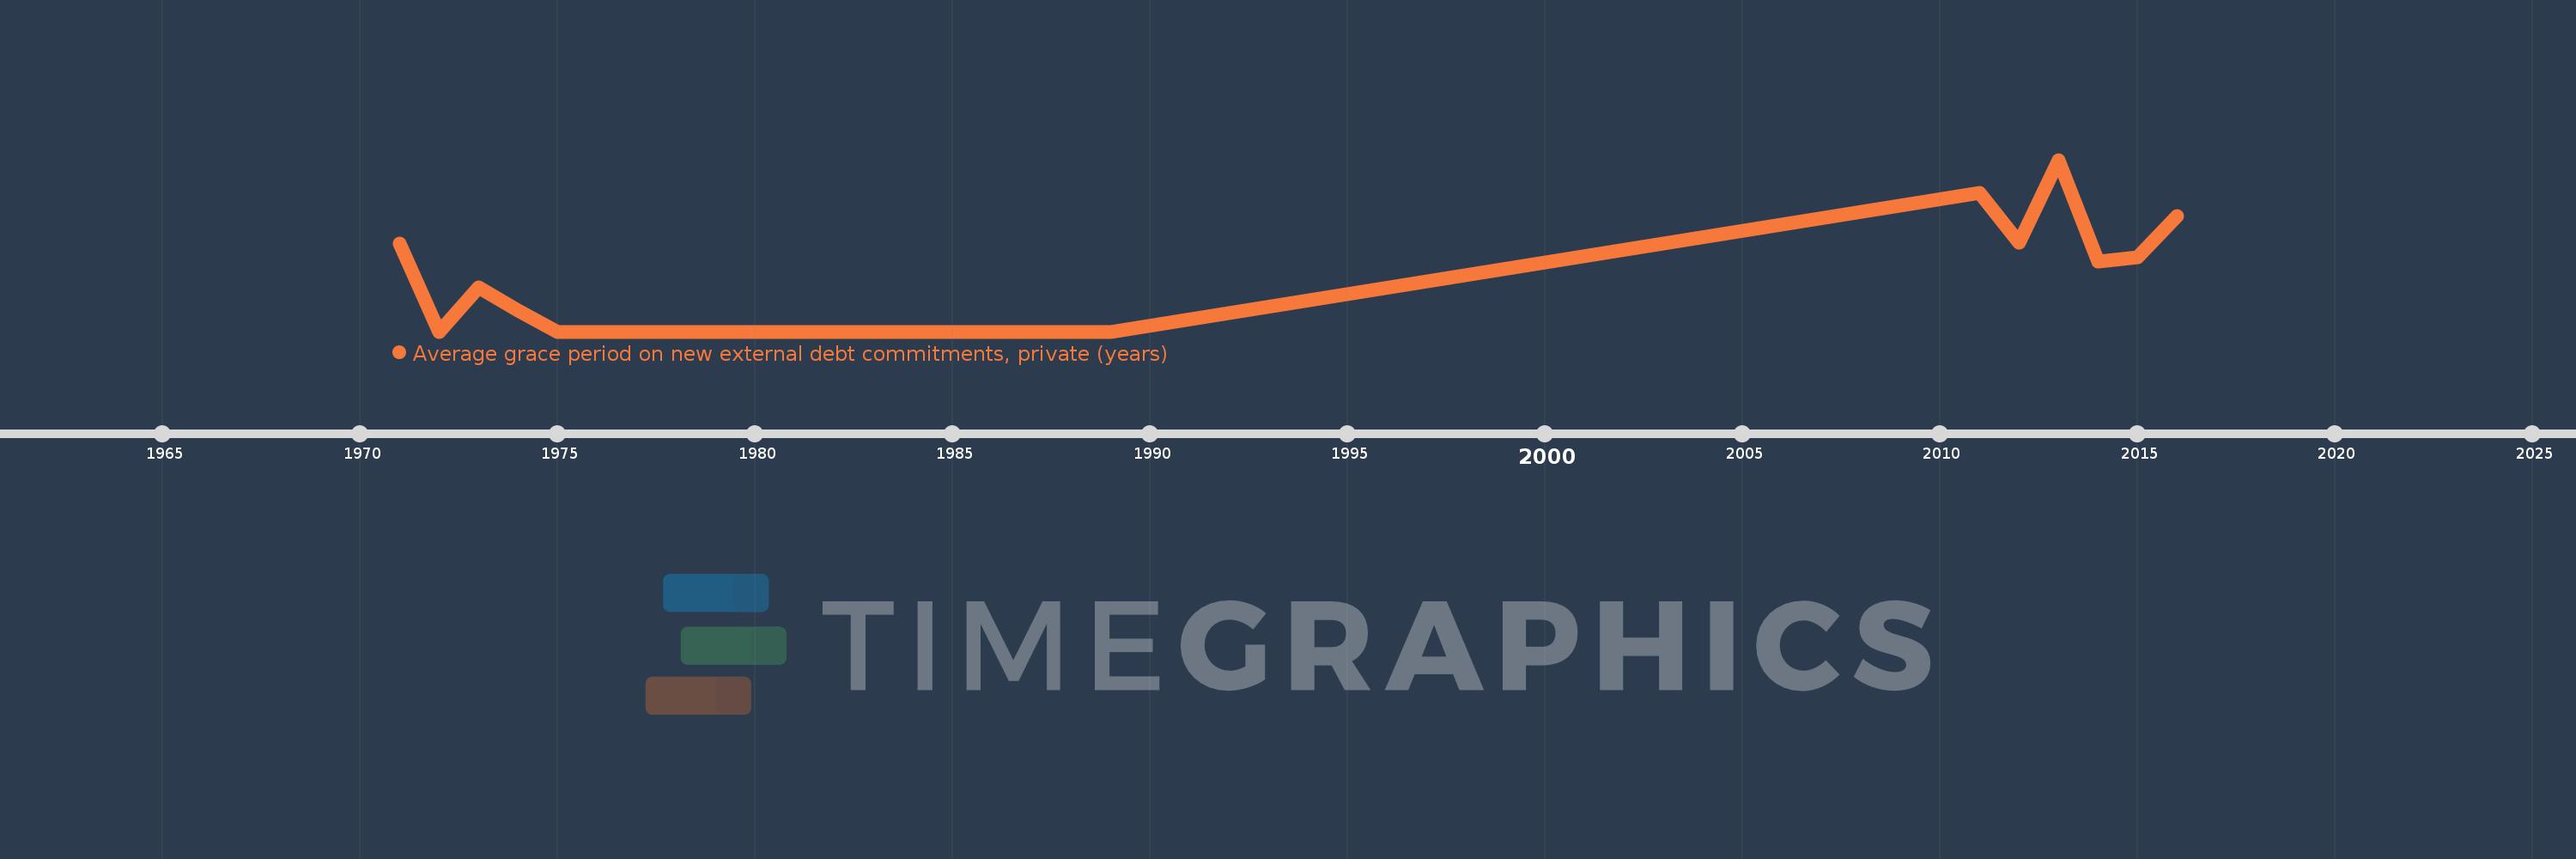
Average grace period on new external debt commitments, private (years)
2016,2015,2014,2013,2012,2011,1989,1988,1987,1986,1985,1984,1983,1982,1981,1980,1979,1978,1977,1976,1975,1974,1973,1972,1971
This statistics in other country:
Timeline:
This timeline shows a graph from 1971 to 2016 of Lao PDR. No data until 1970. Number of actual observations by date: 25.
Source name:
World Development Indicators
Source organization:
World Bank, International Debt Statistics.
Categories, topics:
External Debt
Last updated:
apr 23, 2017
Indicators value changes by year
Maximum:
10.917
jan 1, 2013
At the date of observation
Value
Absolute change
Change from previous value
jan 1, 1972
0.0
-5.6
-100.0%
jan 1, 1974
1.361
-1.439
-51.41%
jan 1, 1975
0.0
-1.361
-100.0%
jan 1, 2011
8.833
+8.833
%
jan 1, 2012
5.667
-3.167
-35.85%
jan 1, 2013
10.917
+5.25
92.65%
jan 1, 2014
4.45
-6.466
-59.23%
jan 1, 2015
4.711
+0.261
5.86%
jan 1, 2016
7.354
+2.643
56.09%
Ranking of countries by current statistics by years


Comments: