29
/
en
AIzaSyAYiBZKx7MnpbEhh9jyipgxe19OcubqV5w
April 1, 2024
171656
Kuwait
KWT
true
2
1
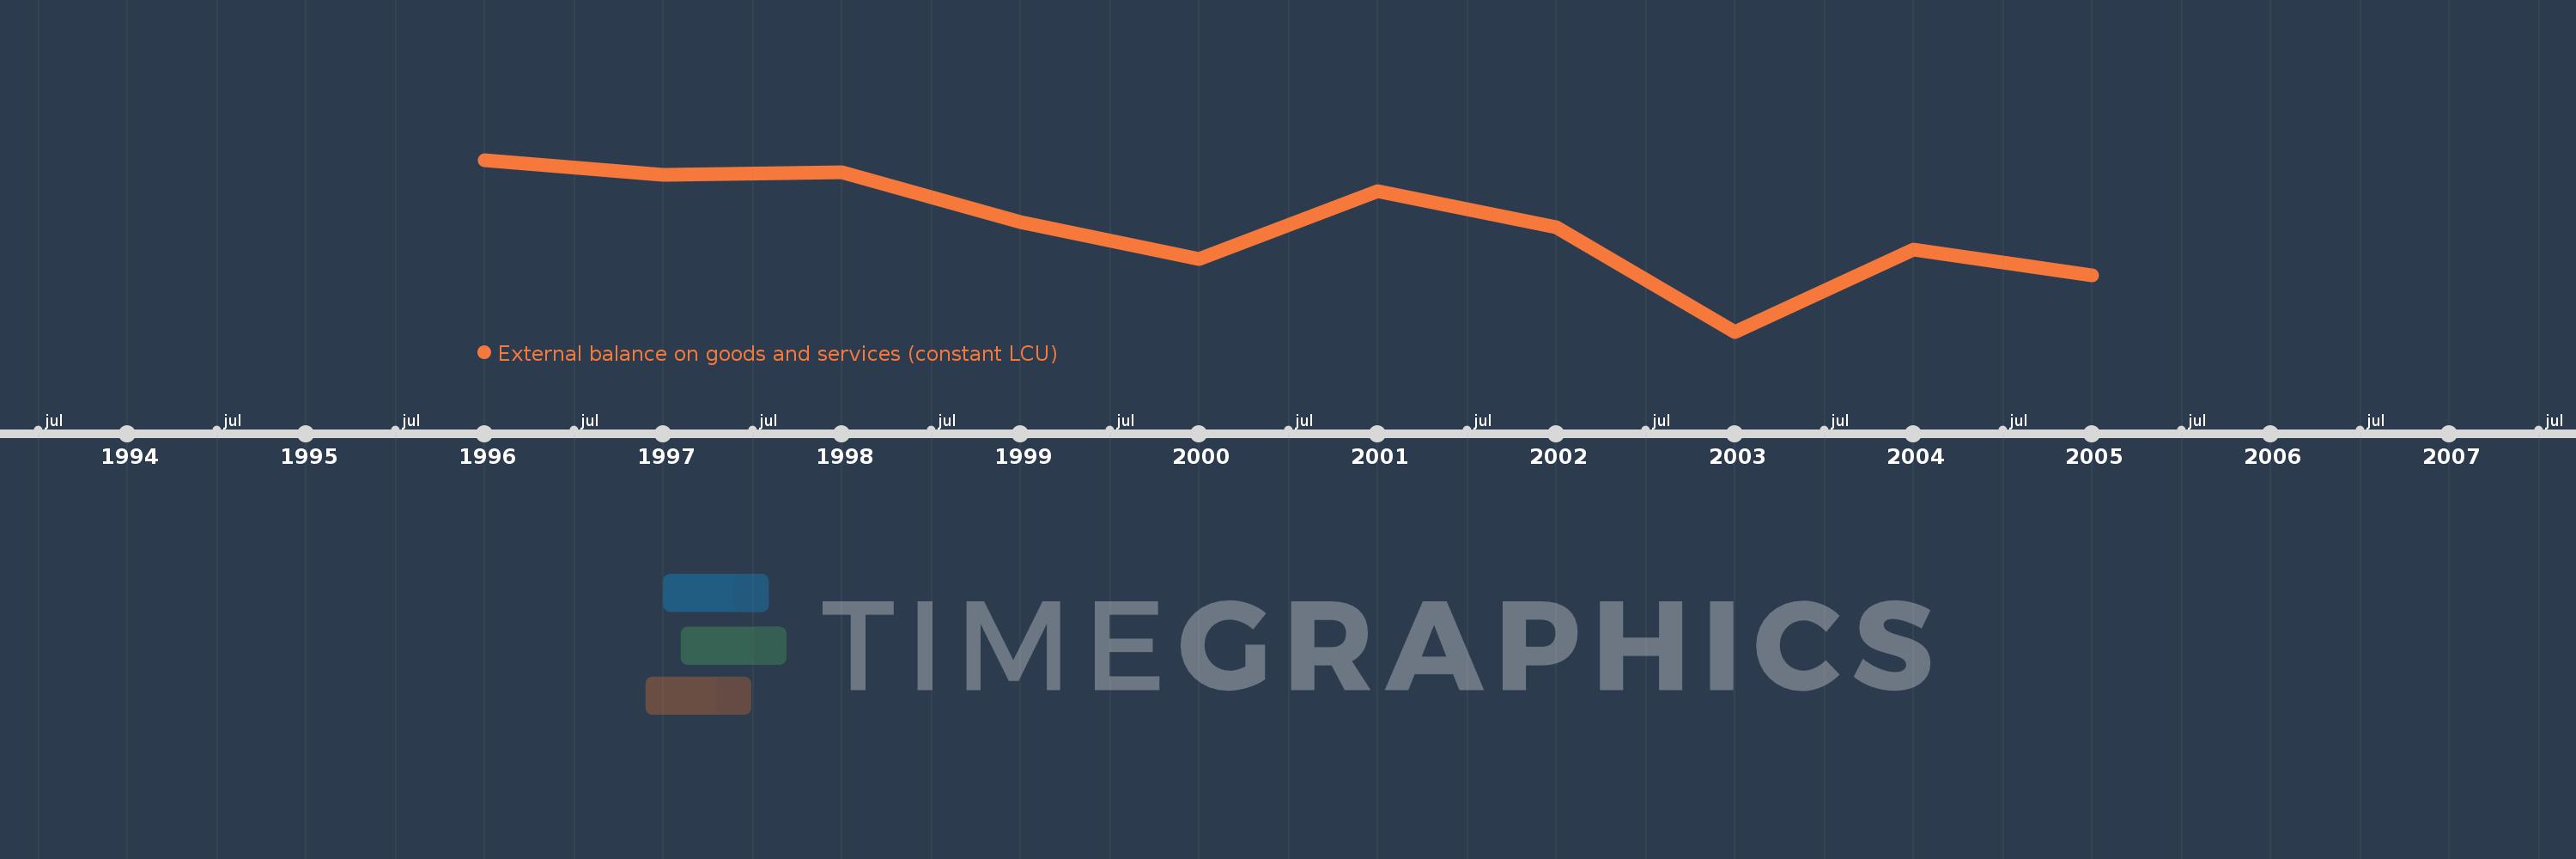
External balance on goods and services (constant LCU)
2005,2004,2003,2002,2001,2000,1999,1998,1997,1996
This statistics in other country:
AlbaniaAlgeriaAngolaArgentinaArmeniaAustraliaAustriaAzerbaijanBahamas, TheBahrainBangladeshBarbadosBelarusBelgiumBelizeBeninBhutanBoliviaBosnia and HerzegovinaBotswanaBrazilBrunei DarussalamBulgariaBurkina FasoBurundiCabo VerdeCambodiaCameroonCanadaCentral African RepublicChadChileChinaColombiaComorosCongo, Dem. Rep.Congo, Rep.Costa RicaCote d'IvoireCroatiaCubaCyprusCzech RepublicDenmarkDjiboutiDominican RepublicEcuadorEgypt, Arab Rep.El SalvadorEquatorial GuineaEritreaEstoniaFijiFinlandFranceGabonGambia, TheGermanyGhanaGreeceGuatemalaGuineaHaitiHondurasHong Kong SAR, ChinaHungaryIcelandIndiaIndonesiaIran, Islamic Rep.IrelandIsraelItalyJamaicaJapanJordanKazakhstanKenyaKorea, Rep.KuwaitKyrgyz RepublicLatviaLebanonLesothoLiberiaLithuaniaLuxembourgMacao SAR, ChinaMacedonia, FYRMadagascarMalawiMalaysiaMaldivesMaliMaltaMauritaniaMauritiusMexicoMoldovaMongoliaMontenegroMoroccoMozambiqueMyanmarNamibiaNepalNetherlandsNew ZealandNicaraguaNigerNigeriaNorwayOmanPakistanPanamaPapua New GuineaParaguayPeruPhilippinesPolandPortugalPuerto RicoRomaniaRussian FederationRwandaSamoaSaudi ArabiaSenegalSerbiaSeychellesSierra LeoneSingaporeSlovak RepublicSloveniaSomaliaSouth AfricaSouth SudanSpainSri LankaSudanSwazilandSwedenSwitzerlandSyrian Arab RepublicTajikistanTanzaniaThailandTimor-LesteTogoTrinidad and TobagoTunisiaTurkeyTurkmenistanUgandaUkraineUnited Arab EmiratesUnited KingdomUnited StatesUruguayUzbekistanVenezuela, RBVietnamWest Bank and GazaZambiaZimbabwe Timeline:
This timeline shows a graph from 1996 to 2005 of Kuwait. No data until 1995. Number of actual observations by date: 10.
Source name:
World Development Indicators
Source organization:
World Bank national accounts data, and OECD National Accounts data files.
Categories, topics:
Economy & Growth
Last updated:
apr 23, 2017
Indicators value changes by year
Minimum:
-386.0 mln
jan 1, 2003
Maximum:
843.0 mln
jan 1, 1996
At the date of observation
Value
Absolute change
Change from previous value
jan 1, 1996
843.0 mln
+843.0 mln
0.0%
jan 1, 1997
734.6 mln
-108.4 mln
-12.86%
jan 1, 1998
756.0 mln
+21.4 mln
2.91%
jan 1, 1999
397.1 mln
-358.9 mln
-47.47%
jan 1, 2000
132.7 mln
-264.4 mln
-66.58%
jan 1, 2001
616.0 mln
+483.3 mln
364.2%
jan 1, 2002
359.8 mln
-256.2 mln
-41.59%
jan 1, 2003
-386.0 mln
-745.8 mln
-207.28%
jan 1, 2004
198.0 mln
+584.0 mln
-151.3%
jan 1, 2005
16.0 mln
-182.0 mln
-91.92%
Ranking of countries by current statistics by years


Comments: