29
/
en
AIzaSyAYiBZKx7MnpbEhh9jyipgxe19OcubqV5w
April 1, 2024
170479
Korea, Rep.
KOR
true
2
1
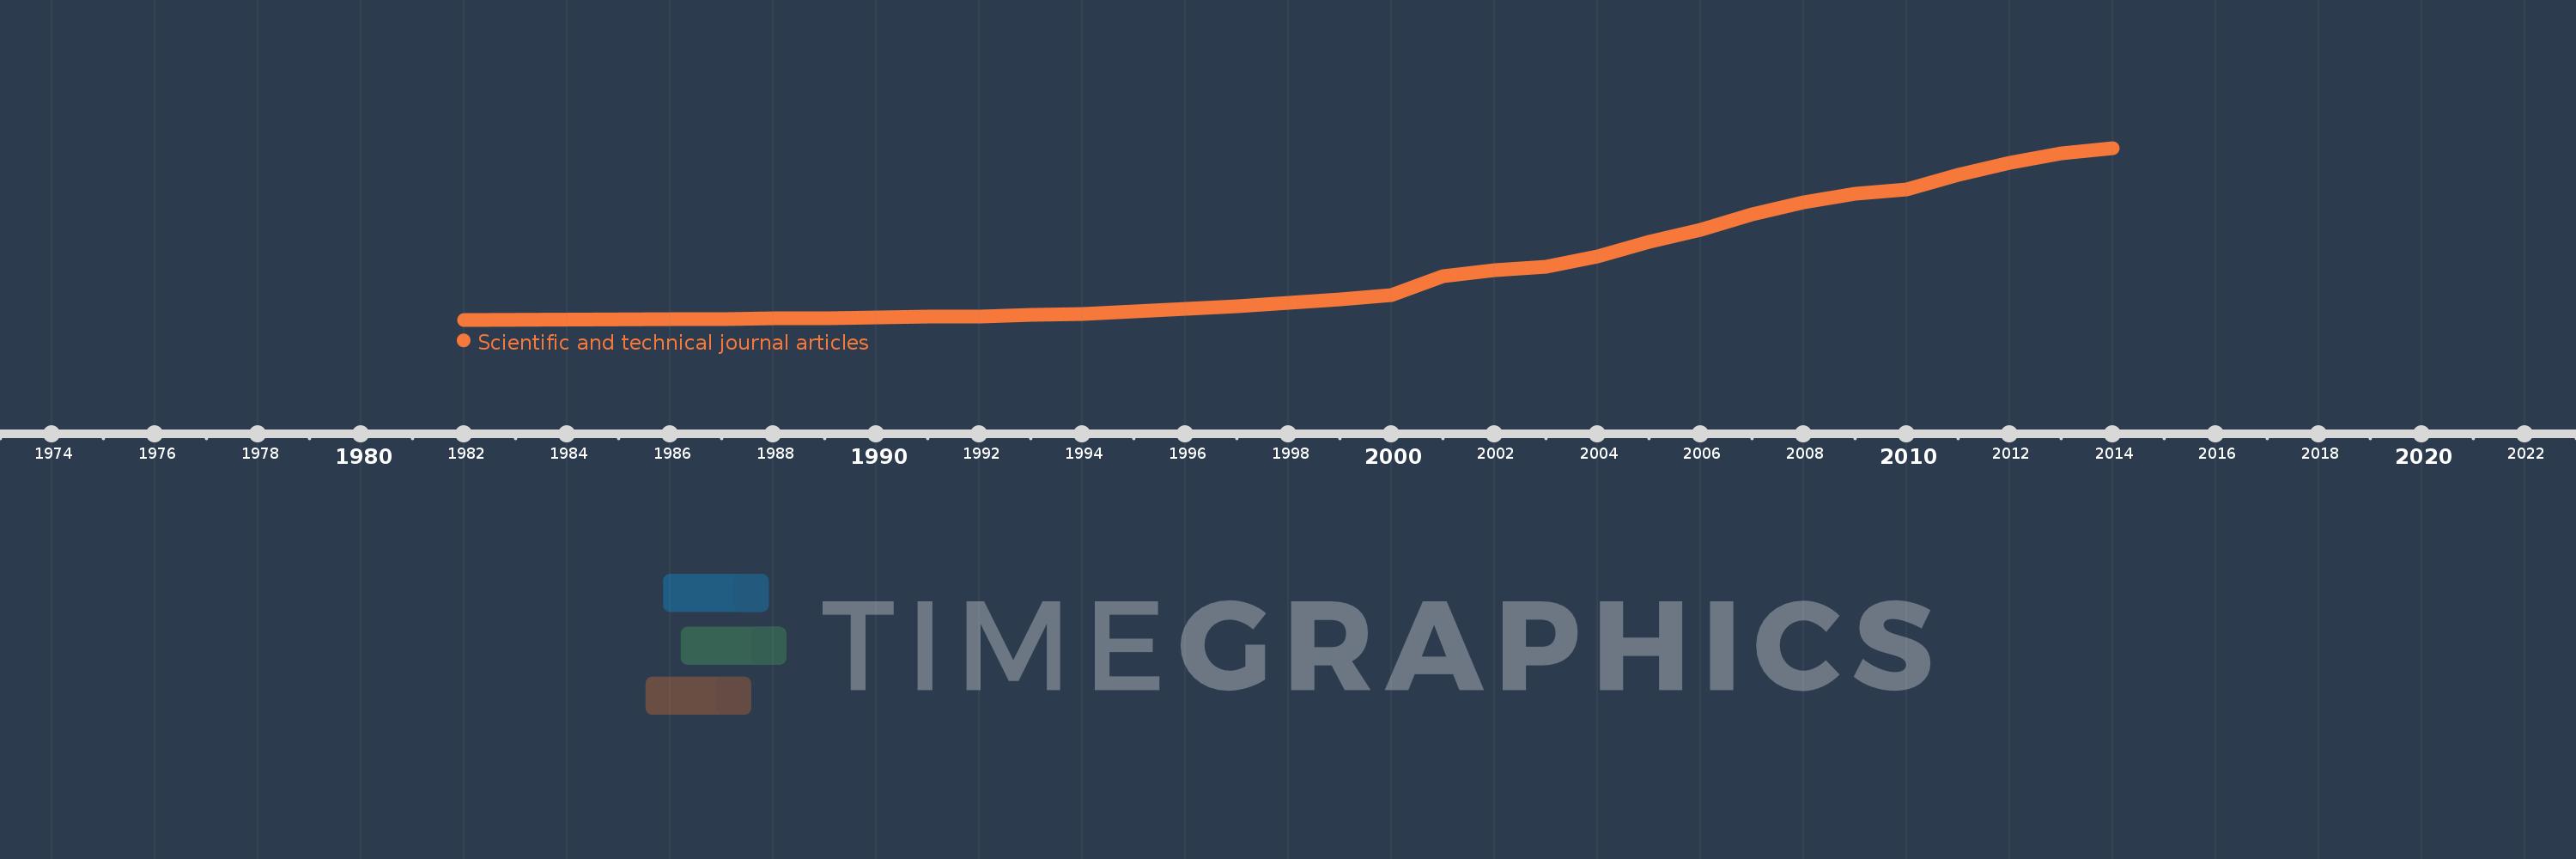
Scientific and technical journal articles
2014,2013,2012,2011,2010,2009,2008,2007,2006,2005,2004,2003,2002,2001,2000,1999,1998,1997,1996,1995,1994,1993,1992,1991,1990,1989,1988,1987,1986,1982
This statistics in other country:
AfghanistanAlbaniaAlgeriaAndorraAngolaAntigua and BarbudaArab WorldArgentinaArmeniaAustraliaAustriaAzerbaijanBahamas, TheBahrainBangladeshBarbadosBelarusBelgiumBelizeBeninBhutanBoliviaBosnia and HerzegovinaBotswanaBrazilBrunei DarussalamBulgariaBurkina FasoBurundiCabo VerdeCambodiaCameroonCanadaCaribbean small statesCentral African RepublicCentral Europe and the BalticsChadChileChinaColombiaComorosCongo, Dem. Rep.Congo, Rep.Costa RicaCote d'IvoireCroatiaCubaCyprusCzech RepublicDenmarkDjiboutiDominicaDominican RepublicEarly-demographic dividendEast Asia & PacificEast Asia & Pacific (excluding high income)East Asia & Pacific (IDA & IBRD countries)EcuadorEgypt, Arab Rep.El SalvadorEquatorial GuineaEritreaEstoniaEthiopiaEuro areaEurope & Central AsiaEurope & Central Asia (excluding high income)Europe & Central Asia (IDA & IBRD countries)European UnionFijiFinlandFragile and conflict affected situationsFranceGabonGambia, TheGeorgiaGermanyGhanaGreeceGrenadaGuatemalaGuineaGuinea-BissauGuyanaHaitiHeavily indebted poor countries (HIPC)High incomeHondurasHong Kong SAR, ChinaHungaryIBRD onlyIcelandIDA & IBRD totalIDA blendIDA onlyIDA totalIndiaIndonesiaIran, Islamic Rep.IraqIrelandIsraelItalyJamaicaJapanJordanKazakhstanKenyaKiribatiKorea, Dem. People’s Rep.Korea, Rep.KosovoKuwaitKyrgyz RepublicLao PDRLate-demographic dividendLatin America & Caribbean Latin America & Caribbean (excluding high income)Latin America & the Caribbean (IDA & IBRD countries)LatviaLeast developed countries: UN classificationLebanonLesothoLiberiaLibyaLiechtensteinLithuaniaLow & middle incomeLow incomeLower middle incomeLuxembourgMacedonia, FYRMadagascarMalawiMalaysiaMaldivesMaliMaltaMarshall IslandsMauritaniaMauritiusMexicoMicronesia, Fed. Sts.Middle East & North AfricaMiddle East & North Africa (excluding high income)Middle East & North Africa (IDA & IBRD countries)Middle incomeMoldovaMonacoMongoliaMontenegroMoroccoMozambiqueMyanmarNamibiaNauruNepalNetherlandsNew ZealandNicaraguaNigerNigeriaNorth AmericaNorwayOECD membersOmanOther small statesPacific island small statesPakistanPalauPanamaPapua New GuineaParaguayPeruPhilippinesPolandPortugalPost-demographic dividendPre-demographic dividendQatarRomaniaRussian FederationRwandaSamoaSan MarinoSao Tome and PrincipeSaudi ArabiaSenegalSerbiaSeychellesSierra LeoneSingaporeSlovak RepublicSloveniaSmall statesSolomon IslandsSomaliaSouth AfricaSouth AsiaSouth Asia (IDA & IBRD)SpainSri LankaSt. Kitts and NevisSt. LuciaSt. Vincent and the GrenadinesSub-Saharan Africa Sub-Saharan Africa (excluding high income)Sub-Saharan Africa (IDA & IBRD countries)SudanSurinameSwazilandSwedenSwitzerlandSyrian Arab RepublicTajikistanTanzaniaThailandTogoTongaTrinidad and TobagoTunisiaTurkeyTurkmenistanTuvaluUgandaUkraineUnited Arab EmiratesUnited KingdomUnited StatesUpper middle incomeUruguayUzbekistanVanuatuVenezuela, RBVietnamWest Bank and GazaWorldYemen, Rep.ZambiaZimbabwe Timeline:
This timeline shows a graph from 1982 to 2014 of Korea, Rep.. No data until 1981. Number of actual observations by date: 30.
Source name:
World Development Indicators
Source organization:
National Science Foundation, Science and Engineering Indicators.
Categories, topics:
Science & Technology
Last updated:
apr 23, 2017
Indicators value changes by year
Maximum:
58.844K
jan 1, 2014
At the date of observation
Value
Absolute change
Change from previous value
jan 1, 1982
168.0
+168.0
0.0%
jan 1, 1986
424.0
+256.0
152.38%
jan 1, 1987
516.0
+92.0
21.7%
jan 1, 1988
672.0
+156.0
30.23%
jan 1, 1989
771.0
+99.0
14.73%
jan 1, 1990
1.035K
+264.0
34.24%
jan 1, 1991
1.17K
+135.0
13.04%
jan 1, 1992
1.361K
+191.0
16.32%
jan 1, 1993
1.759K
+398.0
29.24%
jan 1, 1994
2.184K
+425.0
24.16%
jan 1, 1995
2.931K
+747.0
34.2%
jan 1, 1996
3.803K
+872.2
29.76%
jan 1, 1997
4.771K
+967.7
25.44%
jan 1, 1998
5.802K
+1.031K
21.62%
jan 1, 1999
7.057K
+1.254K
21.62%
jan 1, 2000
8.478K
+1.422K
20.15%
jan 1, 2001
14.958K
+6.48K
76.43%
jan 1, 2002
17.12K
+2.162K
14.46%
jan 1, 2003
18.345K
+1.224K
7.15%
jan 1, 2004
21.802K
+3.457K
18.85%
jan 1, 2005
26.74K
+4.938K
22.65%
jan 1, 2006
30.926K
+4.186K
15.65%
jan 1, 2007
36.03K
+5.104K
16.51%
jan 1, 2008
40.2K
+4.17K
11.57%
jan 1, 2009
43.095K
+2.895K
7.2%
jan 1, 2010
44.684K
+1.589K
3.69%
jan 1, 2011
49.539K
+4.855K
10.87%
jan 1, 2012
53.821K
+4.282K
8.64%
jan 1, 2013
56.897K
+3.076K
5.71%
jan 1, 2014
58.844K
+1.947K
3.42%
Ranking of countries by current statistics by years


Comments: