29
/
en
AIzaSyAYiBZKx7MnpbEhh9jyipgxe19OcubqV5w
April 1, 2024
169460
Korea, Dem. People’s Rep.
PRK
true
2
1
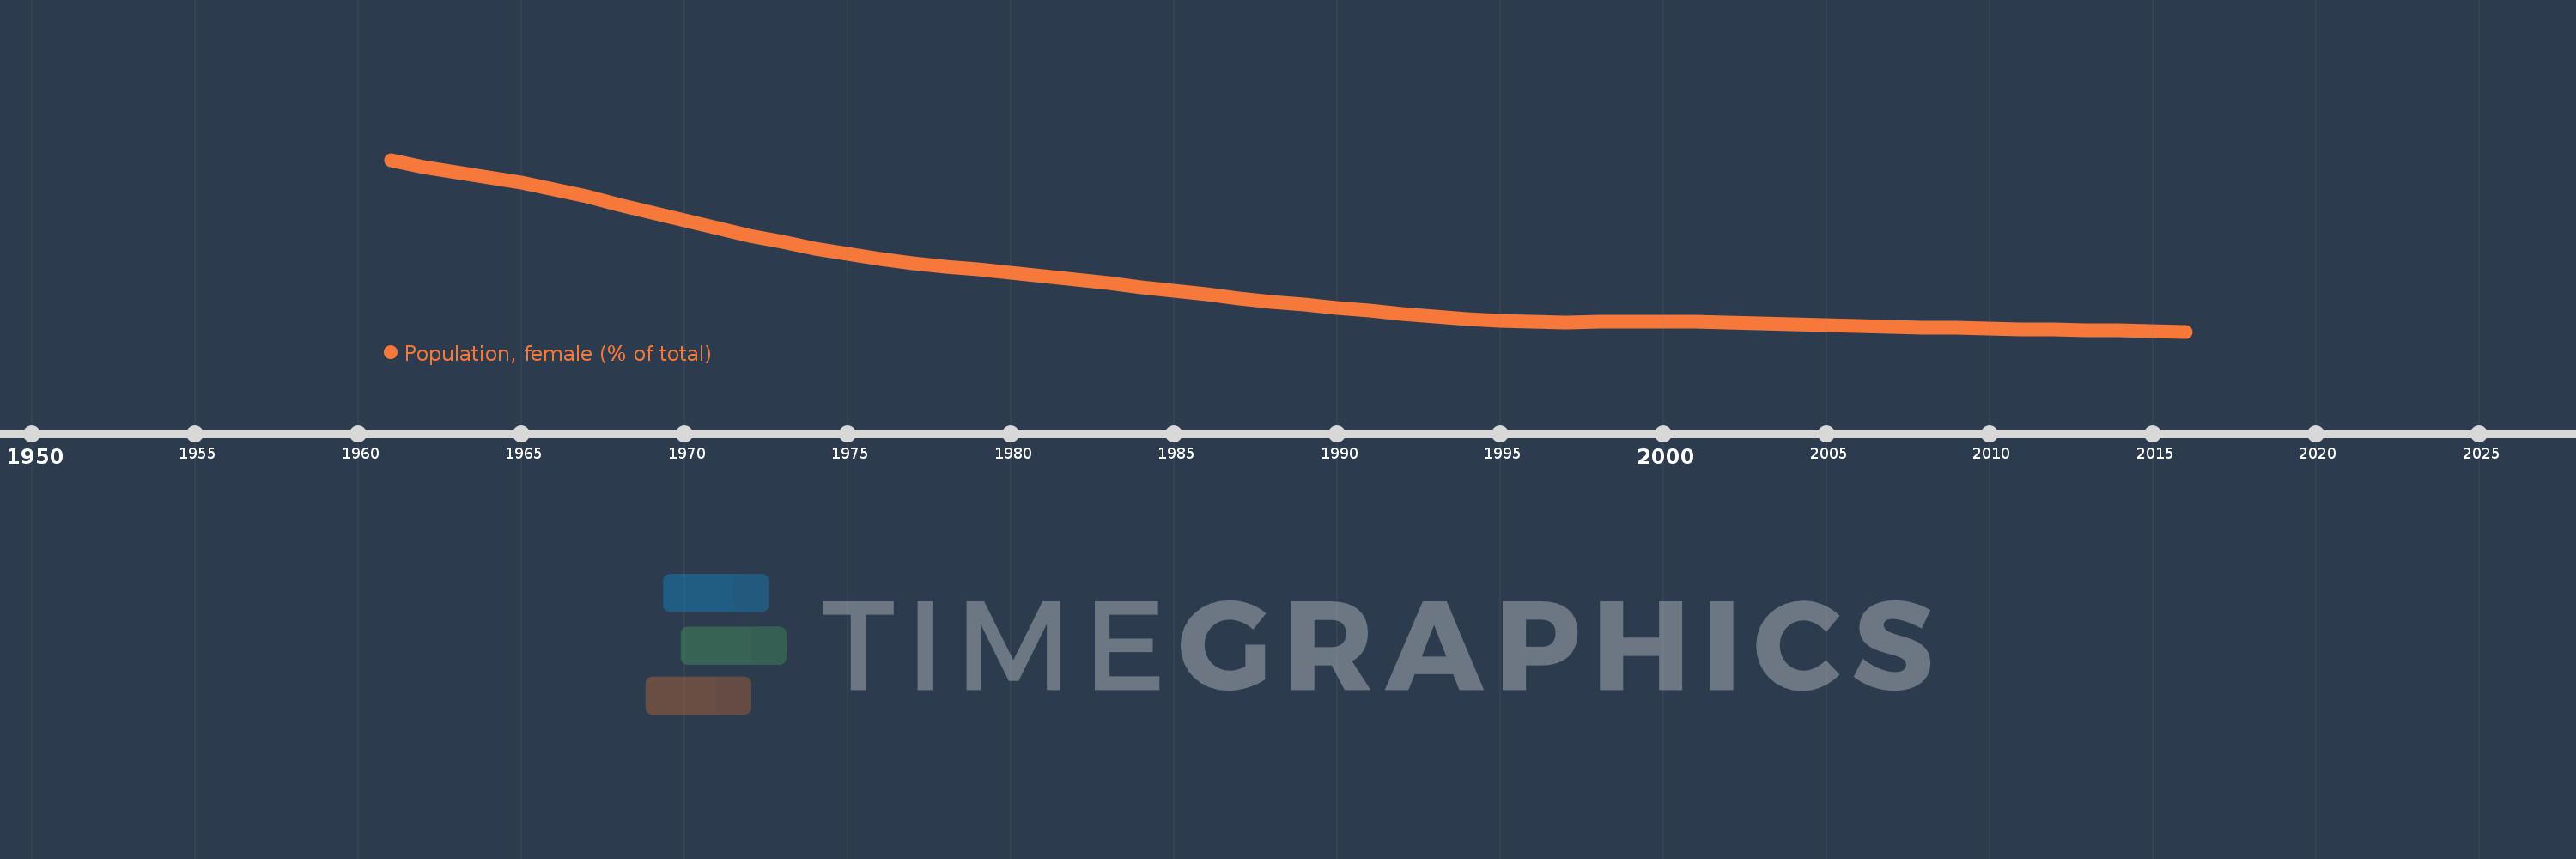
Population, female (% of total)
2016,2015,2014,2013,2012,2011,2010,2009,2008,2007,2006,2005,2004,2003,2002,2001,2000,1999,1998,1997,1996,1995,1994,1993,1992,1991,1990,1989,1988,1987,1986,1985,1984,1983,1982,1981,1980,1979,1978,1977,1976,1975,1974,1973,1972,1971,1970,1969,1968,1967,1966,1965,1964,1963,1962,1961
This statistics in other country:
AfghanistanAlbaniaAlgeriaAngolaAntigua and BarbudaArab WorldArgentinaArmeniaArubaAustraliaAustriaAzerbaijanBahamas, TheBahrainBangladeshBarbadosBelarusBelgiumBelizeBeninBhutanBoliviaBosnia and HerzegovinaBotswanaBrazilBrunei DarussalamBulgariaBurkina FasoBurundiCabo VerdeCambodiaCameroonCanadaCaribbean small statesCentral African RepublicCentral Europe and the BalticsChadChannel IslandsChileChinaColombiaComorosCongo, Dem. Rep.Congo, Rep.Costa RicaCote d'IvoireCroatiaCubaCuracaoCyprusCzech RepublicDenmarkDjiboutiDominican RepublicEarly-demographic dividendEast Asia & PacificEast Asia & Pacific (excluding high income)East Asia & Pacific (IDA & IBRD countries)EcuadorEgypt, Arab Rep.El SalvadorEquatorial GuineaEritreaEstoniaEthiopiaEuro areaEurope & Central AsiaEurope & Central Asia (excluding high income)Europe & Central Asia (IDA & IBRD countries)European UnionFijiFinlandFragile and conflict affected situationsFranceFrench PolynesiaGabonGambia, TheGeorgiaGermanyGhanaGreeceGrenadaGuamGuatemalaGuineaGuinea-BissauGuyanaHaitiHeavily indebted poor countries (HIPC)High incomeHondurasHong Kong SAR, ChinaHungaryIBRD onlyIcelandIDA & IBRD totalIDA blendIDA onlyIDA totalIndiaIndonesiaIran, Islamic Rep.IraqIrelandIsraelItalyJamaicaJapanJordanKazakhstanKenyaKiribatiKorea, Dem. People’s Rep.Korea, Rep.KosovoKuwaitKyrgyz RepublicLao PDRLate-demographic dividendLatin America & Caribbean Latin America & Caribbean (excluding high income)Latin America & the Caribbean (IDA & IBRD countries)LatviaLeast developed countries: UN classificationLebanonLesothoLiberiaLibyaLithuaniaLow & middle incomeLow incomeLower middle incomeLuxembourgMacao SAR, ChinaMacedonia, FYRMadagascarMalawiMalaysiaMaldivesMaliMaltaMauritaniaMauritiusMexicoMicronesia, Fed. Sts.Middle East & North AfricaMiddle East & North Africa (excluding high income)Middle East & North Africa (IDA & IBRD countries)Middle incomeMoldovaMongoliaMontenegroMoroccoMozambiqueMyanmarNamibiaNepalNetherlandsNew CaledoniaNew ZealandNicaraguaNigerNigeriaNorth AmericaNorwayOECD membersOmanOther small statesPacific island small statesPakistanPanamaPapua New GuineaParaguayPeruPhilippinesPolandPortugalPost-demographic dividendPre-demographic dividendPuerto RicoQatarRomaniaRussian FederationRwandaSamoaSao Tome and PrincipeSaudi ArabiaSenegalSerbiaSeychellesSierra LeoneSingaporeSlovak RepublicSloveniaSmall statesSolomon IslandsSomaliaSouth AfricaSouth AsiaSouth Asia (IDA & IBRD)South SudanSpainSri LankaSt. LuciaSt. Vincent and the GrenadinesSub-Saharan Africa Sub-Saharan Africa (excluding high income)Sub-Saharan Africa (IDA & IBRD countries)SudanSurinameSwazilandSwedenSwitzerlandSyrian Arab RepublicTajikistanTanzaniaThailandTimor-LesteTogoTongaTrinidad and TobagoTunisiaTurkeyTurkmenistanUgandaUkraineUnited Arab EmiratesUnited KingdomUnited StatesUpper middle incomeUruguayUzbekistanVanuatuVenezuela, RBVietnamVirgin Islands (U.S.)West Bank and GazaWorldYemen, Rep.ZambiaZimbabwe Timeline:
This timeline shows a graph from 1961 to 2016 of Korea, Dem. People’s Rep.. No data until 1960. Number of actual observations by date: 56.
Source name:
World Development Indicators
Source organization:
World Bank staff estimates based on male/female distributions of United Nations Population Division's World Population Prospects.
Categories, topics:
Health
Last updated:
apr 23, 2017
Indicators value changes by year
Minimum:
51.105
jan 1, 2016
Maximum:
53.789
jan 1, 1961
At the date of observation
Value
Absolute change
Change from previous value
jan 1, 1961
53.789
+53.789
0.0%
jan 1, 1962
53.68
-0.109
-0.2%
jan 1, 1963
53.593
-0.087
-0.16%
jan 1, 1964
53.516
-0.077
-0.14%
jan 1, 1965
53.432
-0.084
-0.16%
jan 1, 1966
53.331
-0.101
-0.19%
jan 1, 1967
53.215
-0.116
-0.22%
jan 1, 1968
53.091
-0.124
-0.23%
jan 1, 1969
52.963
-0.128
-0.24%
jan 1, 1970
52.838
-0.125
-0.24%
jan 1, 1971
52.72
-0.118
-0.22%
jan 1, 1972
52.607
-0.112
-0.21%
jan 1, 1973
52.501
-0.107
-0.2%
jan 1, 1974
52.402
-0.098
-0.19%
jan 1, 1975
52.314
-0.088
-0.17%
jan 1, 1976
52.239
-0.076
-0.14%
jan 1, 1977
52.175
-0.064
-0.12%
jan 1, 1978
52.122
-0.054
-0.1%
jan 1, 1979
52.074
-0.048
-0.09%
jan 1, 1980
52.025
-0.048
-0.09%
jan 1, 1981
51.974
-0.052
-0.1%
jan 1, 1982
51.918
-0.056
-0.11%
jan 1, 1983
51.86
-0.058
-0.11%
jan 1, 1984
51.8
-0.06
-0.12%
jan 1, 1985
51.741
-0.059
-0.11%
jan 1, 1986
51.683
-0.057
-0.11%
jan 1, 1987
51.628
-0.055
-0.11%
jan 1, 1988
51.574
-0.053
-0.1%
jan 1, 1989
51.523
-0.051
-0.1%
jan 1, 1990
51.474
-0.049
-0.1%
jan 1, 1991
51.428
-0.046
-0.09%
jan 1, 1992
51.384
-0.044
-0.09%
jan 1, 1993
51.342
-0.041
-0.08%
jan 1, 1994
51.306
-0.036
-0.07%
jan 1, 1995
51.278
-0.028
-0.05%
jan 1, 1996
51.26
-0.018
-0.04%
jan 1, 1997
51.252
-0.008
-0.02%
jan 1, 1998
51.253
+0.001
0.0%
jan 1, 1999
51.258
+0.005
0.01%
jan 1, 2000
51.262
+0.004
0.01%
jan 1, 2001
51.26
-0.002
0.0%
jan 1, 2002
51.251
-0.009
-0.02%
jan 1, 2003
51.237
-0.014
-0.03%
jan 1, 2004
51.219
-0.018
-0.03%
jan 1, 2005
51.202
-0.017
-0.03%
jan 1, 2006
51.188
-0.014
-0.03%
jan 1, 2007
51.176
-0.011
-0.02%
jan 1, 2008
51.167
-0.009
-0.02%
jan 1, 2009
51.16
-0.008
-0.01%
jan 1, 2010
51.153
-0.007
-0.01%
jan 1, 2011
51.145
-0.007
-0.01%
jan 1, 2012
51.137
-0.008
-0.02%
jan 1, 2013
51.129
-0.008
-0.02%
jan 1, 2014
51.121
-0.008
-0.02%
jan 1, 2015
51.113
-0.008
-0.02%
jan 1, 2016
51.105
-0.008
-0.02%
Ranking of countries by current statistics by years


Comments: