29
/
en
AIzaSyAYiBZKx7MnpbEhh9jyipgxe19OcubqV5w
April 1, 2024
167237
Kenya
KEN
true
2
1
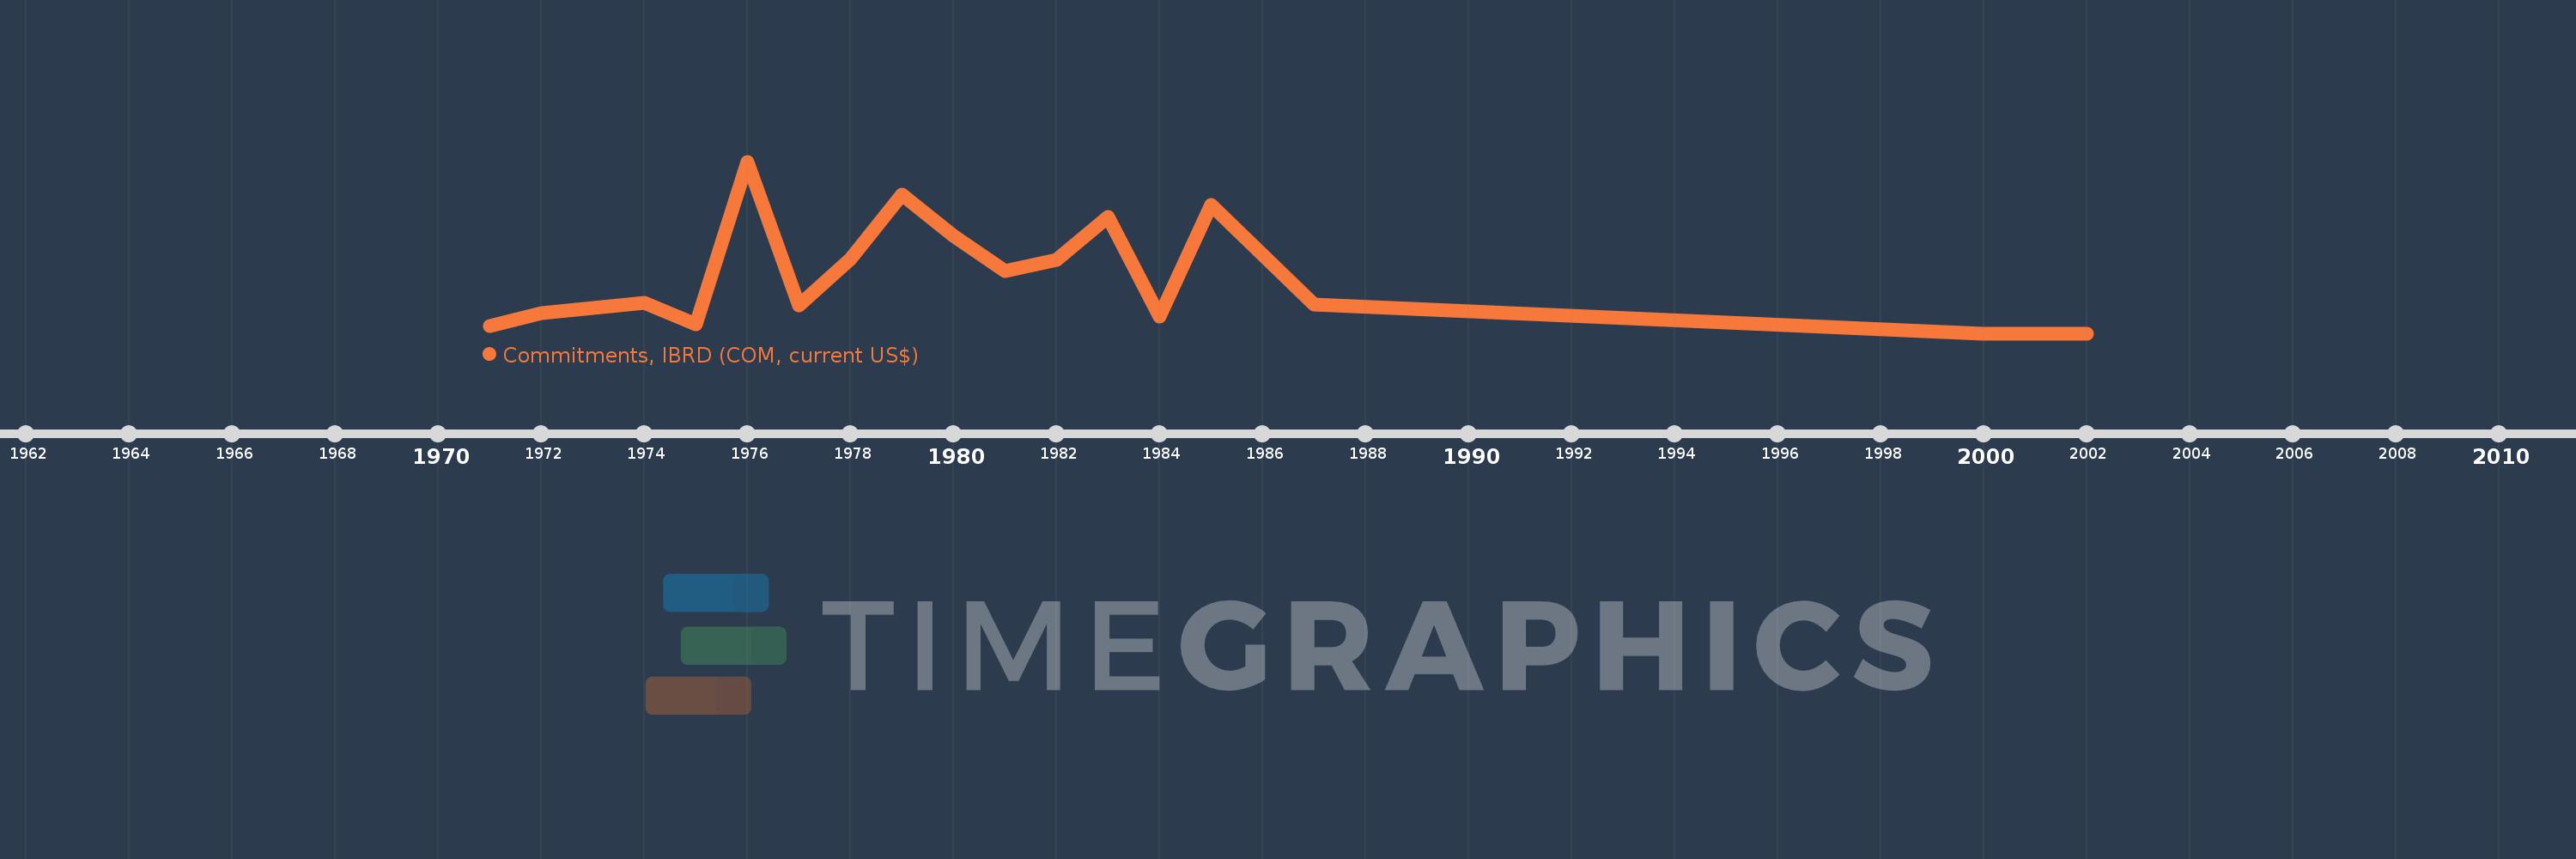
Commitments, IBRD (COM, current US$)
2002,2000,1987,1985,1984,1983,1982,1981,1980,1979,1978,1977,1976,1975,1974,1973,1972,1971
This statistics in other country:
Timeline:
This timeline shows a graph from 1971 to 2002 of Kenya. No data until 1970. Number of actual observations by date: 18.
Source name:
World Development Indicators
Source organization:
World Bank, International Debt Statistics.
Categories, topics:
External Debt
Last updated:
apr 23, 2017
Indicators value changes by year
Maximum:
193.5 mln
jan 1, 1976
At the date of observation
Value
Absolute change
Change from previous value
jan 1, 1971
8.3 mln
+8.3 mln
0.0%
jan 1, 1972
23.0 mln
+14.7 mln
177.11%
jan 1, 1973
29.0 mln
+6.0 mln
26.09%
jan 1, 1974
34.0 mln
+5.0 mln
17.24%
jan 1, 1975
10.4 mln
-23.6 mln
-69.41%
jan 1, 1976
193.5 mln
+183.1 mln
1.76K%
jan 1, 1977
31.0 mln
-162.5 mln
-83.98%
jan 1, 1978
84.0 mln
+53.0 mln
170.97%
jan 1, 1979
156.0 mln
+72.0 mln
85.71%
jan 1, 1980
110.0 mln
-46.0 mln
-29.49%
jan 1, 1981
70.0 mln
-40.0 mln
-36.36%
jan 1, 1982
83.0 mln
+13.0 mln
18.57%
jan 1, 1983
131.1 mln
+48.1 mln
57.95%
jan 1, 1984
19.0 mln
-112.1 mln
-85.51%
jan 1, 1985
145.0 mln
+126.0 mln
663.16%
jan 1, 1987
32.6 mln
-112.4 mln
-77.52%
jan 1, 2000
0.0
-32.6 mln
-100.0%
Ranking of countries by current statistics by years


Comments: