29
/
en
AIzaSyAYiBZKx7MnpbEhh9jyipgxe19OcubqV5w
April 1, 2024
166725
Kazakhstan
KAZ
true
2
1
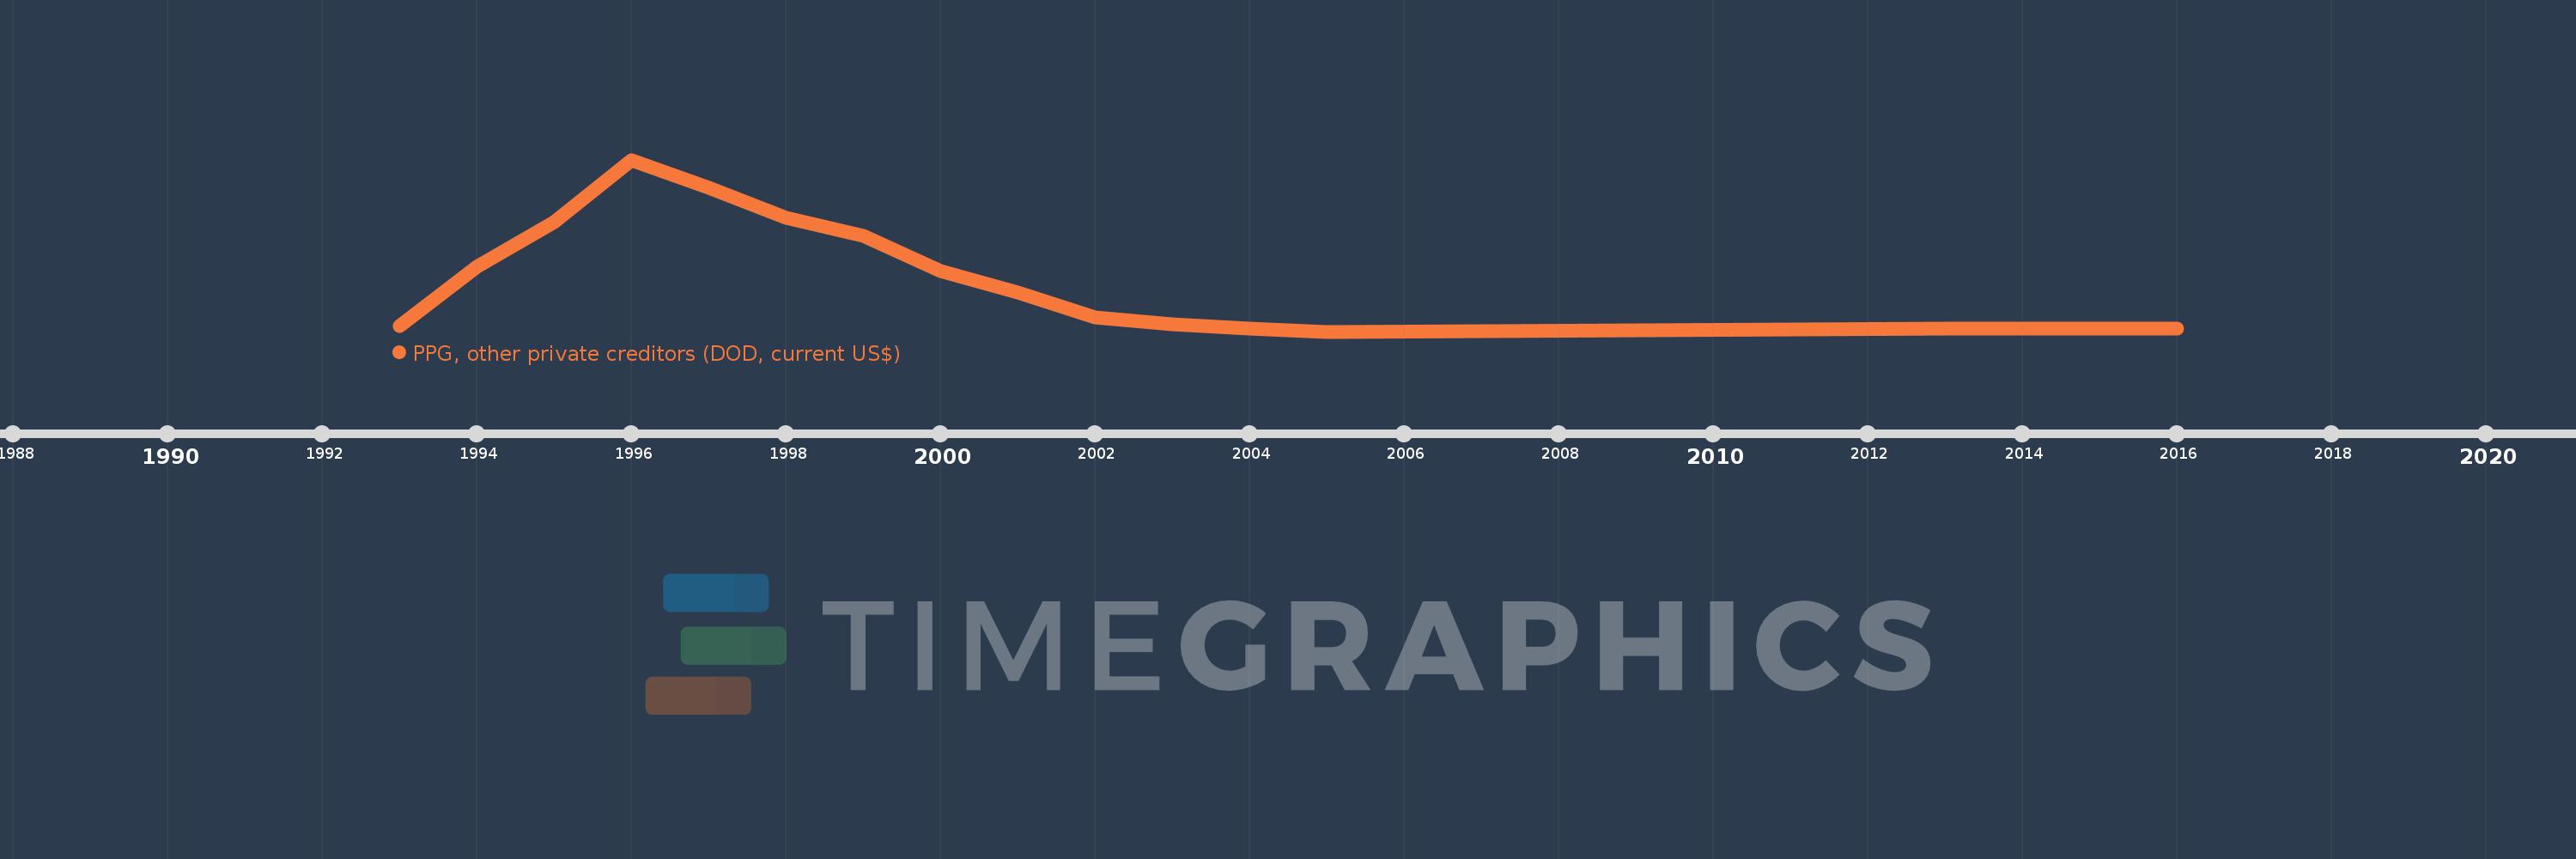
PPG, other private creditors (DOD, current US$)
2016,2015,2014,2013,2005,2004,2003,2002,2001,2000,1999,1998,1997,1996,1995,1994,1993
This statistics in other country:
Timeline:
This timeline shows a graph from 1993 to 2016 of Kazakhstan. No data until 1992. Number of actual observations by date: 17.
Source name:
World Development Indicators
Source organization:
World Bank, International Debt Statistics.
Categories, topics:
External Debt
Last updated:
apr 23, 2017
Indicators value changes by year
Maximum:
523.416 mln
jan 1, 1996
At the date of observation
Value
Absolute change
Change from previous value
jan 1, 1993
15.878 mln
+15.878 mln
0.0%
jan 1, 1994
198.085 mln
+182.207 mln
1.15K%
jan 1, 1995
334.157 mln
+136.072 mln
68.69%
jan 1, 1996
523.416 mln
+189.259 mln
56.64%
jan 1, 1997
438.233 mln
-85.183 mln
-16.27%
jan 1, 1998
347.129 mln
-91.104 mln
-20.79%
jan 1, 1999
291.189 mln
-55.94 mln
-16.12%
jan 1, 2000
183.466 mln
-107.723 mln
-36.99%
jan 1, 2001
120.366 mln
-63.1 mln
-34.39%
jan 1, 2002
42.682 mln
-77.684 mln
-64.54%
jan 1, 2003
21.226 mln
-21.456 mln
-50.27%
jan 1, 2004
10.176 mln
-11.05 mln
-52.06%
jan 1, 2005
0.0
-10.176 mln
-100.0%
jan 1, 2013
9.775 mln
+9.775 mln
%
jan 1, 2014
9.775 mln
0.0
0.0%
jan 1, 2015
9.775 mln
0.0
0.0%
jan 1, 2016
9.775 mln
0.0
0.0%
Ranking of countries by current statistics by years


Comments: