29
/
en
AIzaSyAYiBZKx7MnpbEhh9jyipgxe19OcubqV5w
April 1, 2024
166561
Kazakhstan
KAZ
true
2
1
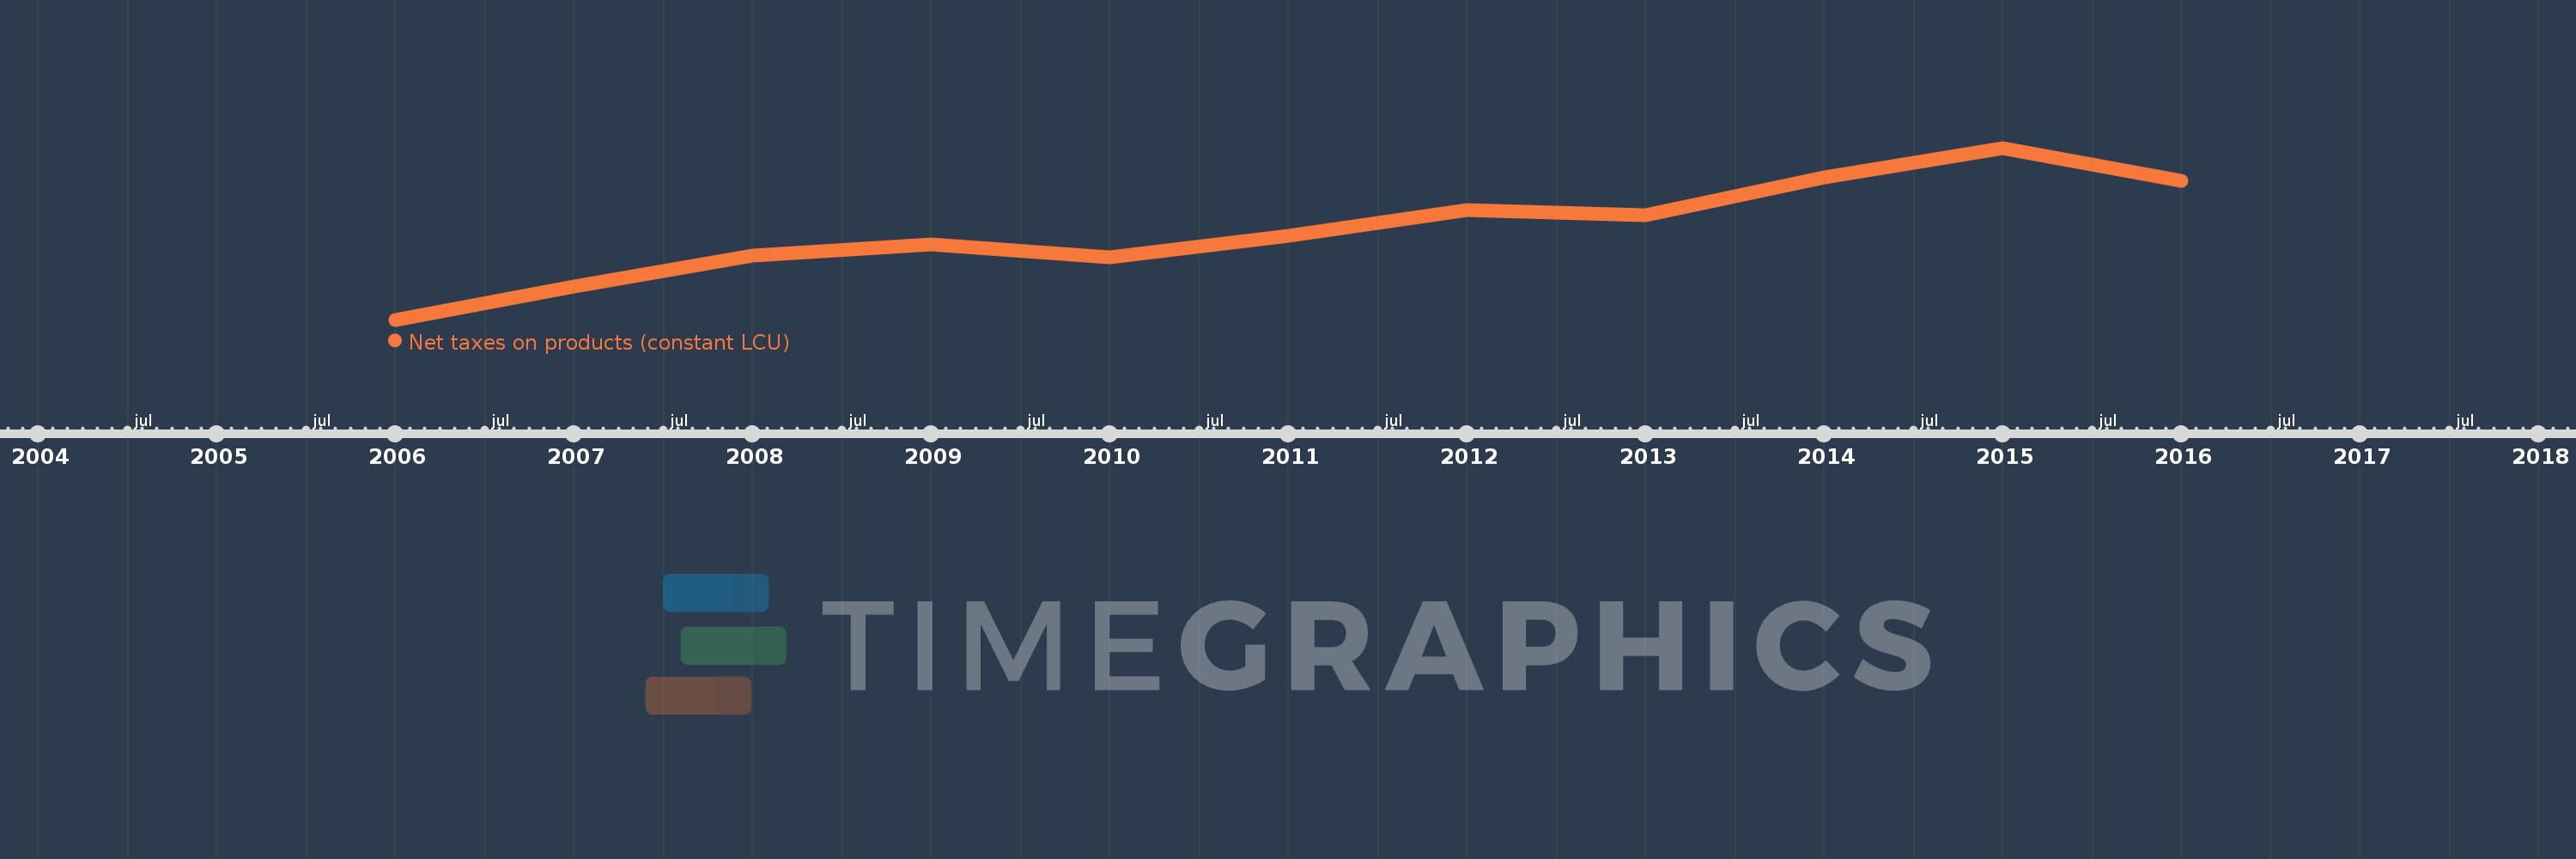
Net taxes on products (constant LCU)
2016,2015,2014,2013,2012,2011,2010,2009,2008,2007,2006
This statistics in other country:
Timeline:
This timeline shows a graph from 2006 to 2016 of Kazakhstan. No data until 2005. Number of actual observations by date: 11.
Source name:
World Development Indicators
Source organization:
World Bank national accounts data, and OECD National Accounts data files.
Categories, topics:
Economy & Growth
Last updated:
apr 23, 2017
Indicators value changes by year
Minimum:
467.85 bln
jan 1, 2006
Maximum:
767.142 bln
jan 1, 2015
At the date of observation
Value
Absolute change
Change from previous value
jan 1, 2006
467.85 bln
+467.85 bln
0.0%
jan 1, 2007
526.331 bln
+58.481 bln
12.5%
jan 1, 2008
580.017 bln
+53.686 bln
10.2%
jan 1, 2009
599.737 bln
+19.721 bln
3.4%
jan 1, 2010
576.348 bln
-23.39 bln
-3.9%
jan 1, 2011
613.81 bln
+37.463 bln
6.5%
jan 1, 2012
658.618 bln
+44.808 bln
7.3%
jan 1, 2013
649.398 bln
-9.221 bln
-1.4%
jan 1, 2014
716.286 bln
+66.888 bln
10.3%
jan 1, 2015
767.142 bln
+50.856 bln
7.1%
jan 1, 2016
709.606 bln
-57.536 bln
-7.5%
Ranking of countries by current statistics by years


Comments: