29
/
en
AIzaSyAYiBZKx7MnpbEhh9jyipgxe19OcubqV5w
April 1, 2024
165960
Kazakhstan
KAZ
true
2
1
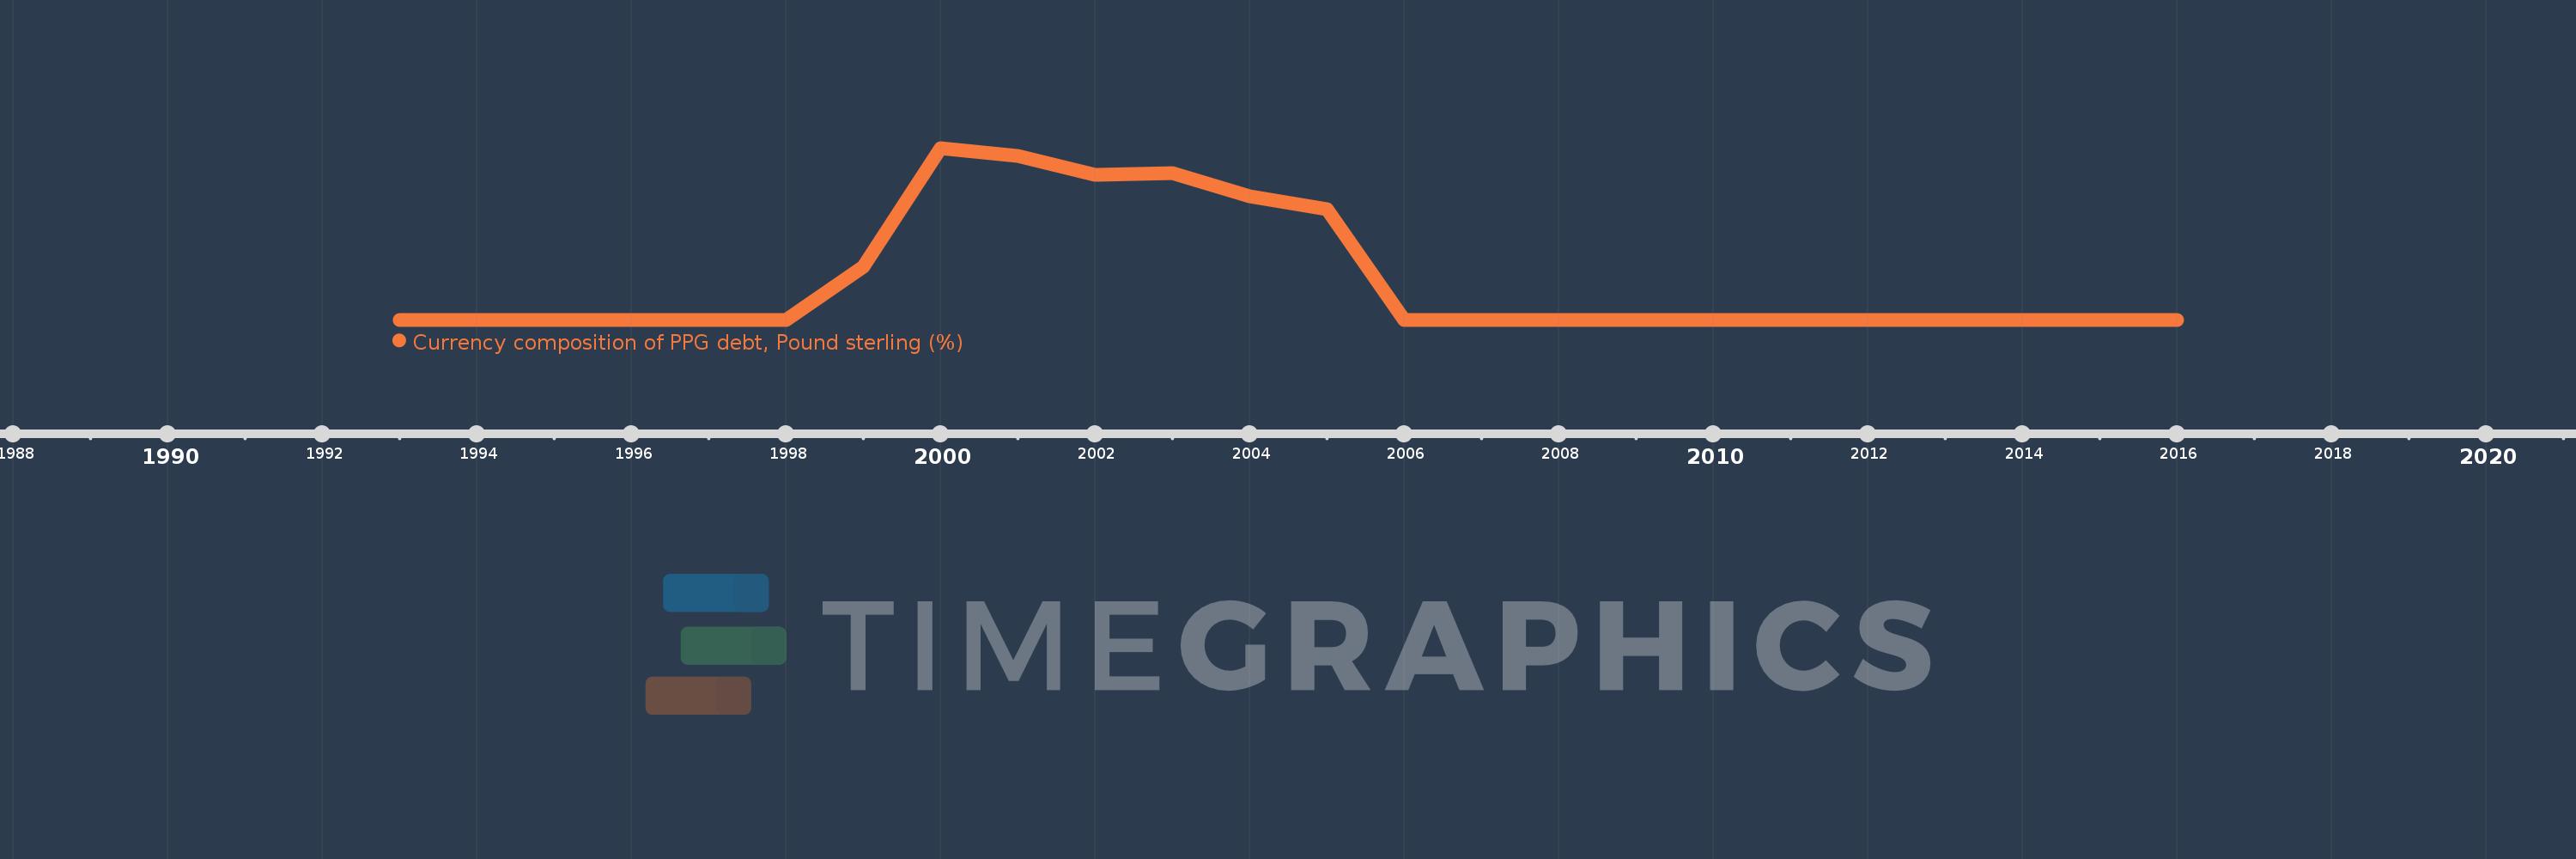
Currency composition of PPG debt, Pound sterling (%)
2016,2015,2014,2013,2012,2011,2010,2009,2008,2007,2006,2005,2004,2003,2002,2001,2000,1999,1998,1997,1996,1995,1994,1993
This statistics in other country:
Timeline:
This timeline shows a graph from 1993 to 2016 of Kazakhstan. No data until 1992. Number of actual observations by date: 24.
Source name:
World Development Indicators
Source organization:
World Bank, International Debt Statistics.
Categories, topics:
External Debt
Last updated:
apr 23, 2017
Indicators value changes by year
At the date of observation
Value
Absolute change
Change from previous value
jan 1, 1999
0.204
+0.204
%
jan 1, 2000
0.663
+0.459
225.44%
jan 1, 2001
0.633
-0.029
-4.42%
jan 1, 2002
0.56
-0.073
-11.56%
jan 1, 2003
0.566
+0.006
1.05%
jan 1, 2004
0.475
-0.091
-16.15%
jan 1, 2005
0.428
-0.046
-9.71%
jan 1, 2006
0.0
-0.428
-100.0%
Ranking of countries by current statistics by years


Comments: