29
/
en
AIzaSyAYiBZKx7MnpbEhh9jyipgxe19OcubqV5w
April 1, 2024
165260
Jordan
JOR
true
2
1
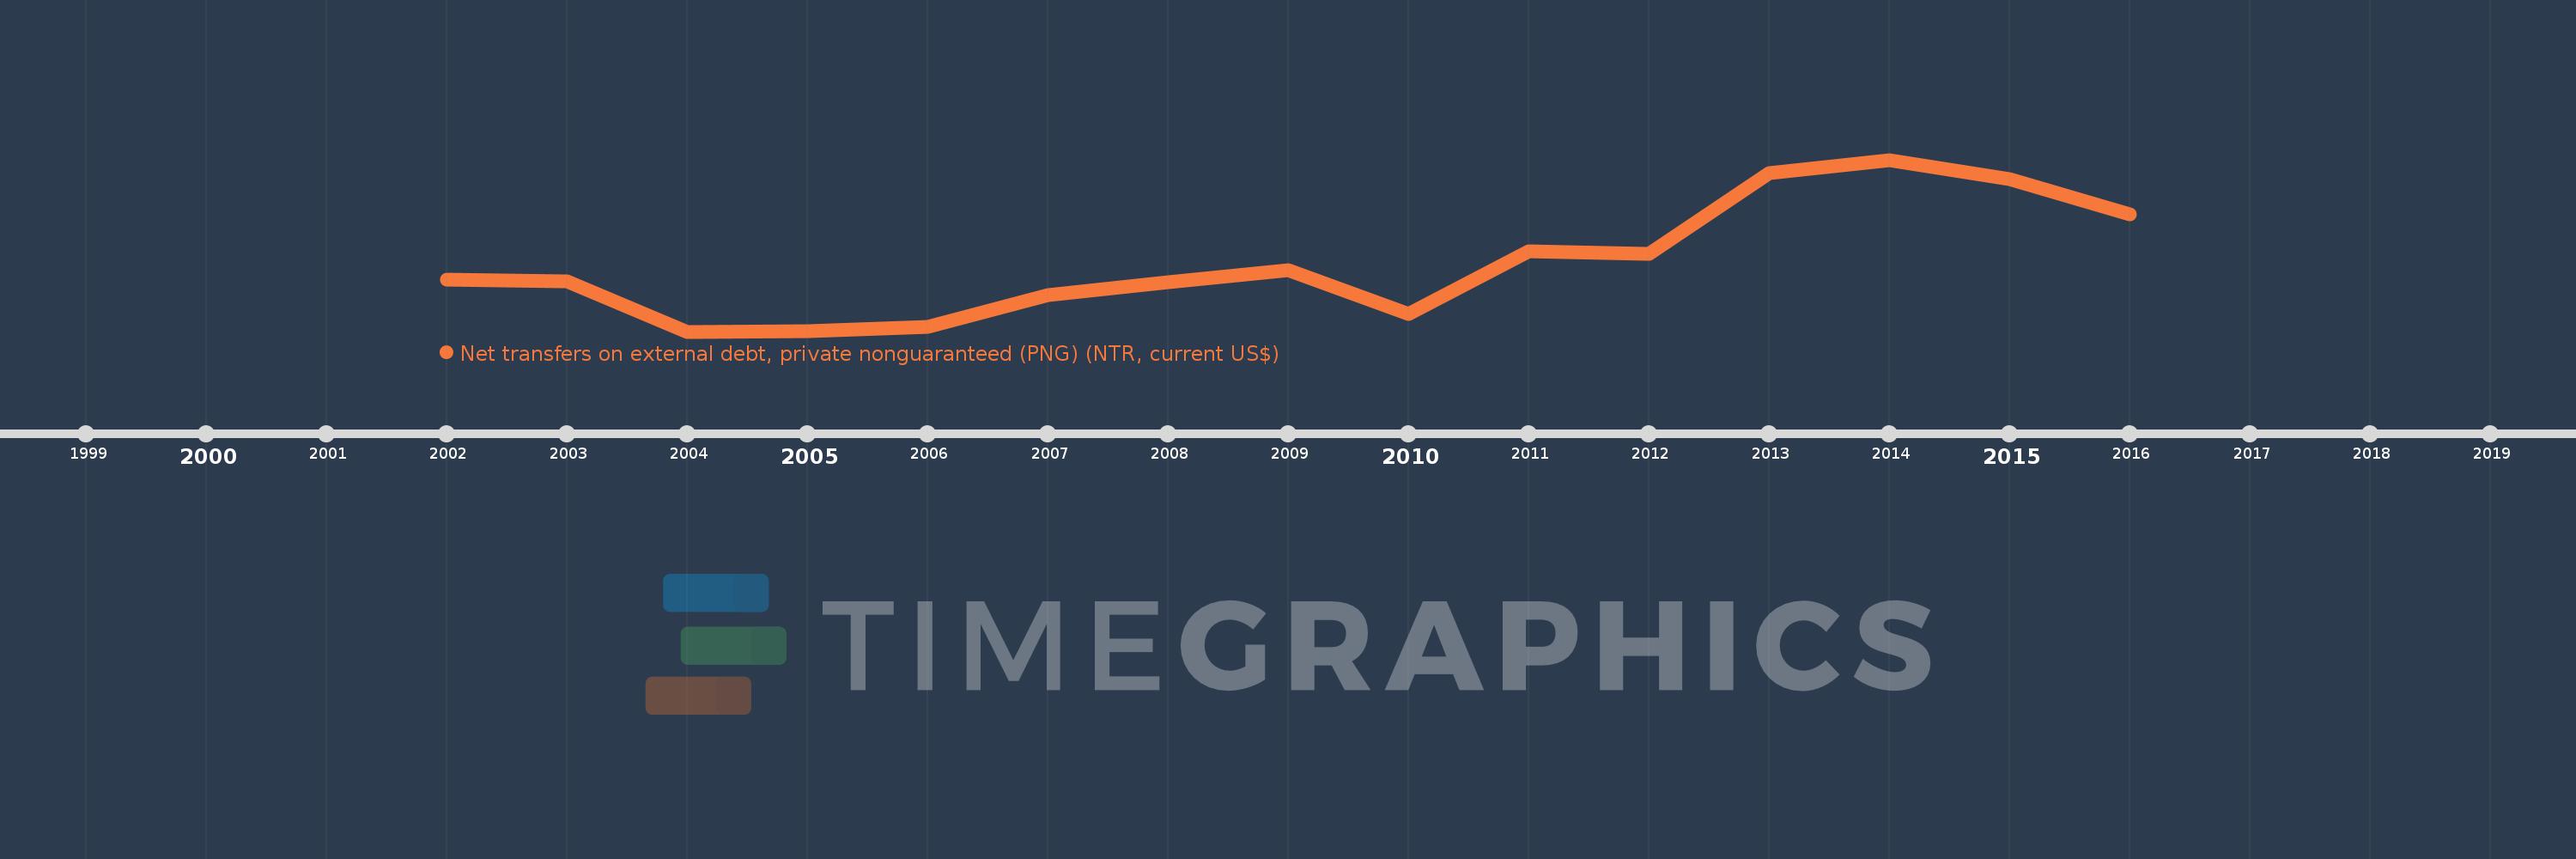
Net transfers on external debt, private nonguaranteed (PNG) (NTR, current US$)
2016,2015,2014,2013,2012,2011,2010,2009,2008,2007,2006,2005,2004,2003,2002
This statistics in other country:
Timeline:
This timeline shows a graph from 2002 to 2016 of Jordan. No data until 2001. Number of actual observations by date: 15.
Source name:
World Development Indicators
Source organization:
World Bank, International Debt Statistics.
Categories, topics:
External Debt
Last updated:
apr 23, 2017
Indicators value changes by year
Minimum:
-34.499 mln
jan 1, 2004
Maximum:
268.917 mln
jan 1, 2014
At the date of observation
Value
Absolute change
Change from previous value
jan 1, 2002
56.597 mln
+56.597 mln
0.0%
jan 1, 2003
53.814 mln
-2.783 mln
-4.92%
jan 1, 2004
-34.499 mln
-88.313 mln
-164.11%
jan 1, 2005
-34.409 mln
+90.0K
-0.26%
jan 1, 2006
-26.0 mln
+8.409 mln
-24.44%
jan 1, 2007
29.248 mln
+55.248 mln
-212.49%
jan 1, 2008
52.727 mln
+23.479 mln
80.28%
jan 1, 2009
74.63 mln
+21.903 mln
41.54%
jan 1, 2010
-2.921 mln
-77.551 mln
-103.91%
jan 1, 2011
107.522 mln
+110.443 mln
-3.78K%
jan 1, 2012
102.049 mln
-5.473 mln
-5.09%
jan 1, 2013
245.157 mln
+143.108 mln
140.23%
jan 1, 2014
268.917 mln
+23.76 mln
9.69%
jan 1, 2015
234.558 mln
-34.359 mln
-12.78%
jan 1, 2016
171.862 mln
-62.696 mln
-26.73%
Ranking of countries by current statistics by years


Comments: