29
/
en
AIzaSyAYiBZKx7MnpbEhh9jyipgxe19OcubqV5w
April 1, 2024
165010
Jordan
JOR
true
2
1
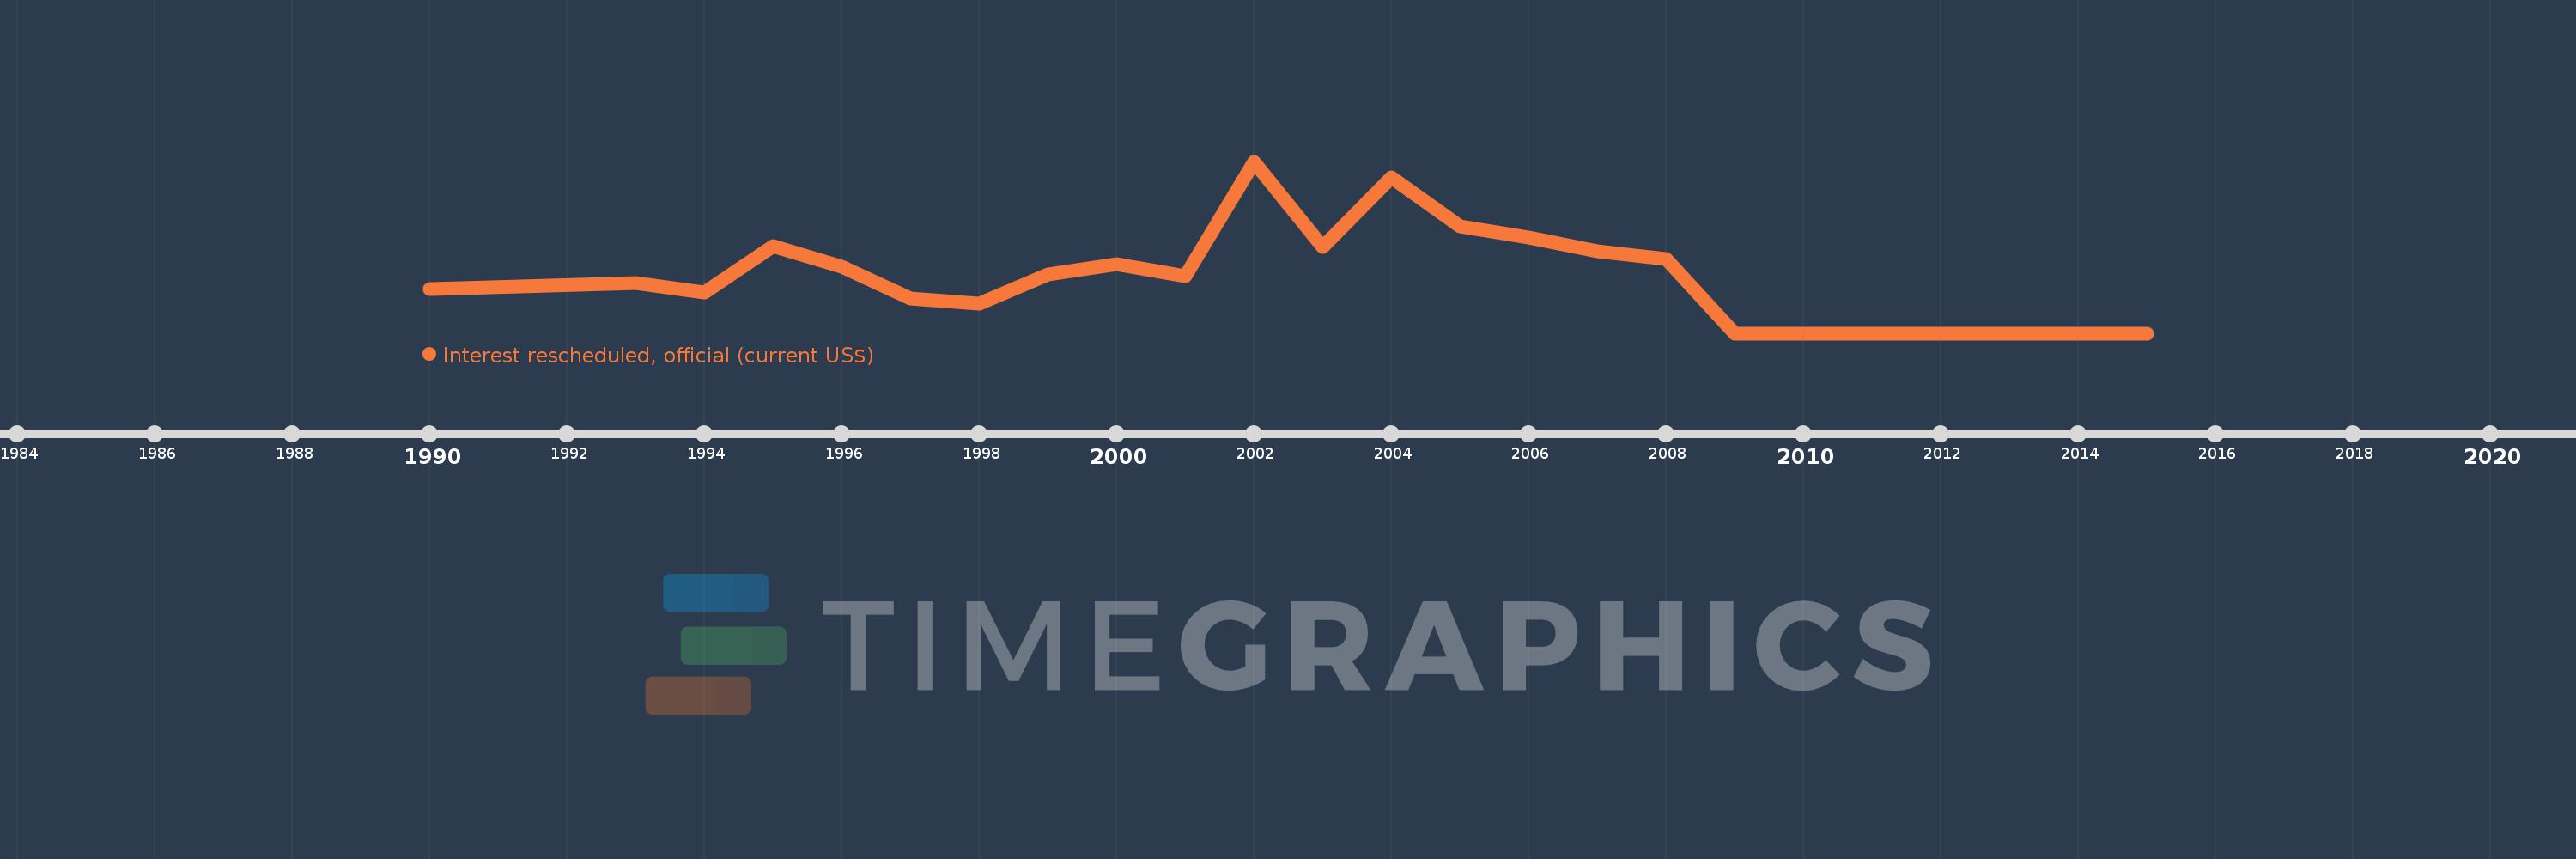
Interest rescheduled, official (current US$)
2015,2011,2009,2008,2007,2006,2005,2004,2003,2002,2001,2000,1999,1998,1997,1996,1995,1994,1993,1990
This statistics in other country:
Timeline:
This timeline shows a graph from 1990 to 2015 of Jordan. No data until 1989. Number of actual observations by date: 20.
Source name:
World Development Indicators
Source organization:
World Bank, International Debt Statistics.
Categories, topics:
External Debt
Last updated:
apr 23, 2017
Indicators value changes by year
Maximum:
139.522 mln
jan 1, 2002
At the date of observation
Value
Absolute change
Change from previous value
jan 1, 1990
35.76 mln
+35.76 mln
0.0%
jan 1, 1993
40.55 mln
+4.79 mln
13.39%
jan 1, 1994
33.005 mln
-7.545 mln
-18.61%
jan 1, 1995
71.135 mln
+38.13 mln
115.53%
jan 1, 1996
53.84 mln
-17.295 mln
-24.31%
jan 1, 1997
28.101 mln
-25.739 mln
-47.81%
jan 1, 1998
24.202 mln
-3.899 mln
-13.87%
jan 1, 1999
47.963 mln
+23.761 mln
98.18%
jan 1, 2000
55.825 mln
+7.862 mln
16.39%
jan 1, 2001
46.249 mln
-9.576 mln
-17.15%
jan 1, 2002
139.522 mln
+93.273 mln
201.68%
jan 1, 2003
70.319 mln
-69.203 mln
-49.6%
jan 1, 2004
126.484 mln
+56.165 mln
79.87%
jan 1, 2005
86.666 mln
-39.818 mln
-31.48%
jan 1, 2006
77.49 mln
-9.176 mln
-10.59%
jan 1, 2007
66.406 mln
-11.084 mln
-14.3%
jan 1, 2008
60.215 mln
-6.191 mln
-9.32%
jan 1, 2009
0.0
-60.215 mln
-100.0%
Ranking of countries by current statistics by years


Comments: