29
/
en
AIzaSyAYiBZKx7MnpbEhh9jyipgxe19OcubqV5w
April 1, 2024
164150
Japan
JPN
true
2
1
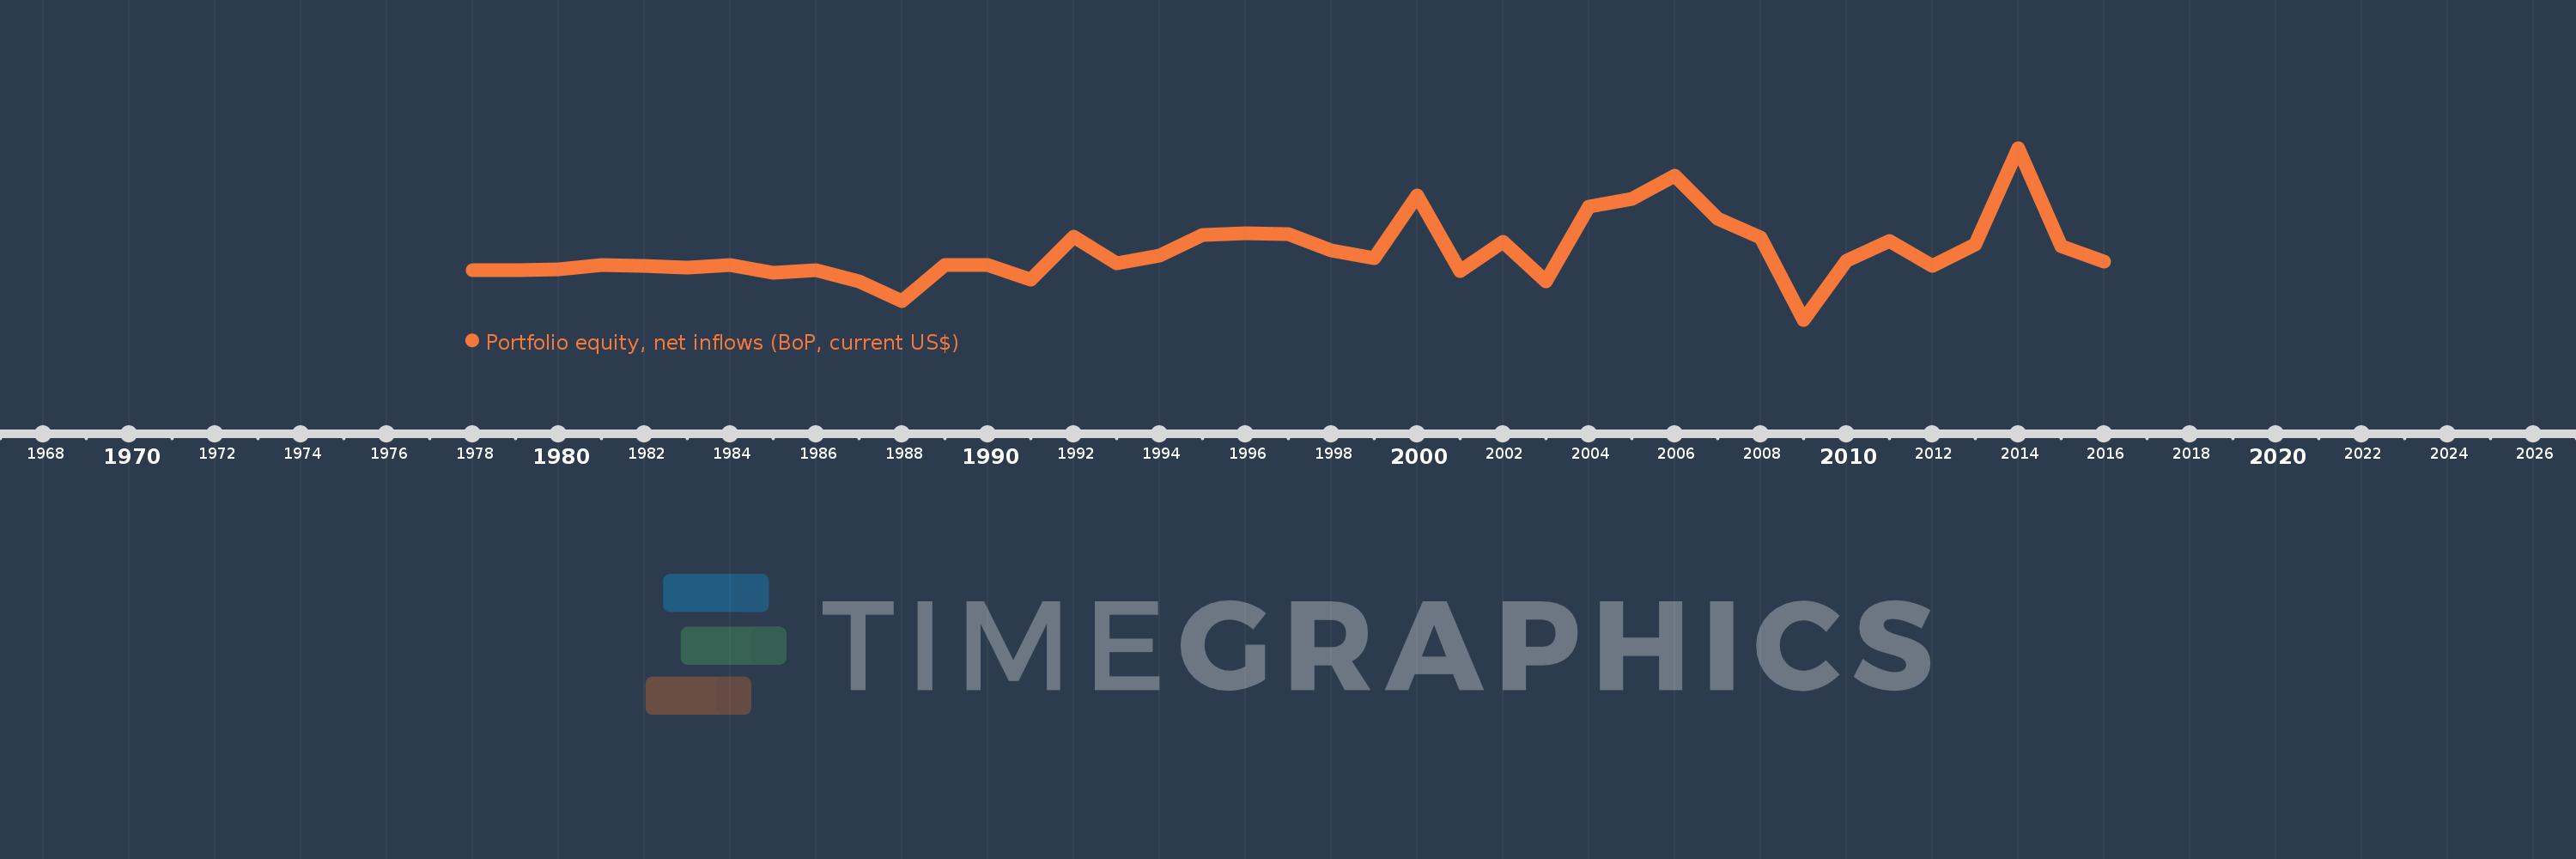
Portfolio equity, net inflows (BoP, current US$)
2016,2015,2014,2013,2012,2011,2010,2009,2008,2007,2006,2005,2004,2003,2002,2001,2000,1999,1998,1997,1996,1995,1994,1993,1992,1991,1990,1989,1988,1987,1986,1985,1984,1983,1982,1981,1980,1979,1978
This statistics in other country:
AfghanistanAlbaniaAlgeriaAngolaAntigua and BarbudaArab WorldArgentinaArmeniaArubaAustraliaAustriaAzerbaijanBahamas, TheBahrainBangladeshBarbadosBelarusBelgiumBelizeBeninBermudaBhutanBoliviaBosnia and HerzegovinaBotswanaBrazilBulgariaBurkina FasoBurundiCabo VerdeCambodiaCameroonCanadaCaribbean small statesCentral African RepublicCentral Europe and the BalticsChadChileChinaColombiaComorosCongo, Dem. Rep.Congo, Rep.Costa RicaCote d'IvoireCroatiaCuracaoCyprusCzech RepublicDenmarkDjiboutiDominicaDominican RepublicEarly-demographic dividendEast Asia & PacificEast Asia & Pacific (excluding high income)East Asia & Pacific (IDA & IBRD countries)EcuadorEgypt, Arab Rep.El SalvadorEquatorial GuineaEstoniaEthiopiaEuro areaEurope & Central AsiaEurope & Central Asia (excluding high income)Europe & Central Asia (IDA & IBRD countries)European UnionFijiFinlandFragile and conflict affected situationsFranceFrench PolynesiaGabonGambia, TheGeorgiaGermanyGhanaGreeceGrenadaGuatemalaGuineaGuinea-BissauGuyanaHaitiHeavily indebted poor countries (HIPC)High incomeHondurasHong Kong SAR, ChinaHungaryIBRD onlyIcelandIDA & IBRD totalIDA blendIDA onlyIDA totalIndiaIndonesiaIran, Islamic Rep.IraqIrelandIsraelItalyJamaicaJapanJordanKazakhstanKenyaKiribatiKorea, Rep.KosovoKuwaitKyrgyz RepublicLao PDRLate-demographic dividendLatin America & Caribbean Latin America & Caribbean (excluding high income)Latin America & the Caribbean (IDA & IBRD countries)LatviaLeast developed countries: UN classificationLebanonLesothoLiberiaLibyaLithuaniaLow & middle incomeLow incomeLower middle incomeLuxembourgMacao SAR, ChinaMacedonia, FYRMadagascarMalawiMalaysiaMaldivesMaliMaltaMarshall IslandsMauritaniaMauritiusMexicoMiddle East & North AfricaMiddle East & North Africa (excluding high income)Middle East & North Africa (IDA & IBRD countries)Middle incomeMoldovaMongoliaMontenegroMoroccoMozambiqueMyanmarNamibiaNepalNetherlandsNew CaledoniaNew ZealandNicaraguaNigerNigeriaNorth AmericaNorwayOECD membersOmanOther small statesPacific island small statesPakistanPanamaPapua New GuineaParaguayPeruPhilippinesPolandPortugalPost-demographic dividendPre-demographic dividendQatarRomaniaRussian FederationRwandaSamoaSao Tome and PrincipeSaudi ArabiaSenegalSerbiaSeychellesSierra LeoneSingaporeSlovak RepublicSloveniaSmall statesSolomon IslandsSomaliaSouth AfricaSouth AsiaSouth Asia (IDA & IBRD)SpainSri LankaSt. Kitts and NevisSt. LuciaSt. Vincent and the GrenadinesSub-Saharan Africa Sub-Saharan Africa (excluding high income)Sub-Saharan Africa (IDA & IBRD countries)SudanSurinameSwazilandSwedenSwitzerlandSyrian Arab RepublicTajikistanTanzaniaThailandTimor-LesteTogoTongaTrinidad and TobagoTunisiaTurkeyUgandaUkraineUnited KingdomUnited StatesUpper middle incomeUruguayVanuatuVenezuela, RBVietnamWest Bank and GazaWorldYemen, Rep.ZambiaZimbabwe Timeline:
This timeline shows a graph from 1978 to 2016 of Japan. No data until 1977. Number of actual observations by date: 39.
Source name:
World Development Indicators
Source organization:
International Monetary Fund, Balance of Payments database, and World Bank, International Debt Statistics.
Categories, topics:
Economy & Growth, Financial Sector, External Debt
Last updated:
apr 23, 2017
Indicators value changes by year
Minimum:
-69.692 bln
jan 1, 2009
Maximum:
169.753 bln
jan 1, 2014
At the date of observation
Value
Absolute change
Change from previous value
jan 1, 1978
-780.0 mln
-780.0 mln
0.0%
jan 1, 1979
-810.0 mln
-30.0 mln
3.85%
jan 1, 1980
330.0 mln
+1.14 bln
-140.74%
jan 1, 1981
6.55 bln
+6.22 bln
1.88K%
jan 1, 1982
5.92 bln
-630.0 mln
-9.62%
jan 1, 1983
2.55 bln
-3.37 bln
-56.93%
jan 1, 1984
6.13 bln
+3.58 bln
140.39%
jan 1, 1985
-3.61 bln
-9.74 bln
-158.89%
jan 1, 1986
-668.227 mln
+2.942 bln
-81.49%
jan 1, 1987
-15.707 bln
-15.039 bln
2.25K%
jan 1, 1988
-43.55 bln
-27.842 bln
177.26%
jan 1, 1989
6.822 bln
+50.372 bln
-115.66%
jan 1, 1990
6.946 bln
+124.303 mln
1.82%
jan 1, 1991
-13.357 bln
-20.303 bln
-292.28%
jan 1, 1992
46.619 bln
+59.976 bln
-449.03%
jan 1, 1993
8.878 bln
-37.741 bln
-80.96%
jan 1, 1994
19.857 bln
+10.979 bln
123.66%
jan 1, 1995
48.947 bln
+29.09 bln
146.5%
jan 1, 1996
50.597 bln
+1.65 bln
3.37%
jan 1, 1997
49.45 bln
-1.147 bln
-2.27%
jan 1, 1998
27.002 bln
-22.449 bln
-45.4%
jan 1, 1999
16.115 bln
-10.887 bln
-40.32%
jan 1, 2000
103.886 bln
+87.772 bln
544.68%
jan 1, 2001
-1.286 bln
-105.172 bln
-101.24%
jan 1, 2002
39.101 bln
+40.387 bln
-3.14K%
jan 1, 2003
-16.69 bln
-55.79 bln
-142.68%
jan 1, 2004
87.775 bln
+104.465 bln
-625.93%
jan 1, 2005
98.28 bln
+10.504 bln
11.97%
jan 1, 2006
131.315 bln
+33.036 bln
33.61%
jan 1, 2007
71.437 bln
-59.878 bln
-45.6%
jan 1, 2008
45.455 bln
-25.982 bln
-36.37%
jan 1, 2009
-69.692 bln
-115.147 bln
-253.32%
jan 1, 2010
12.432 bln
+82.124 bln
-117.84%
jan 1, 2011
40.328 bln
+27.896 bln
224.4%
jan 1, 2012
5.645 bln
-34.684 bln
-86.0%
jan 1, 2013
34.941 bln
+29.297 bln
519.02%
jan 1, 2014
169.753 bln
+134.812 bln
385.83%
jan 1, 2015
32.969 bln
-136.784 bln
-80.58%
jan 1, 2016
10.786 bln
-22.183 bln
-67.29%
Ranking of countries by current statistics by years


Comments: