29
/
en
AIzaSyAYiBZKx7MnpbEhh9jyipgxe19OcubqV5w
April 1, 2024
163196
Jamaica
JAM
true
2
1
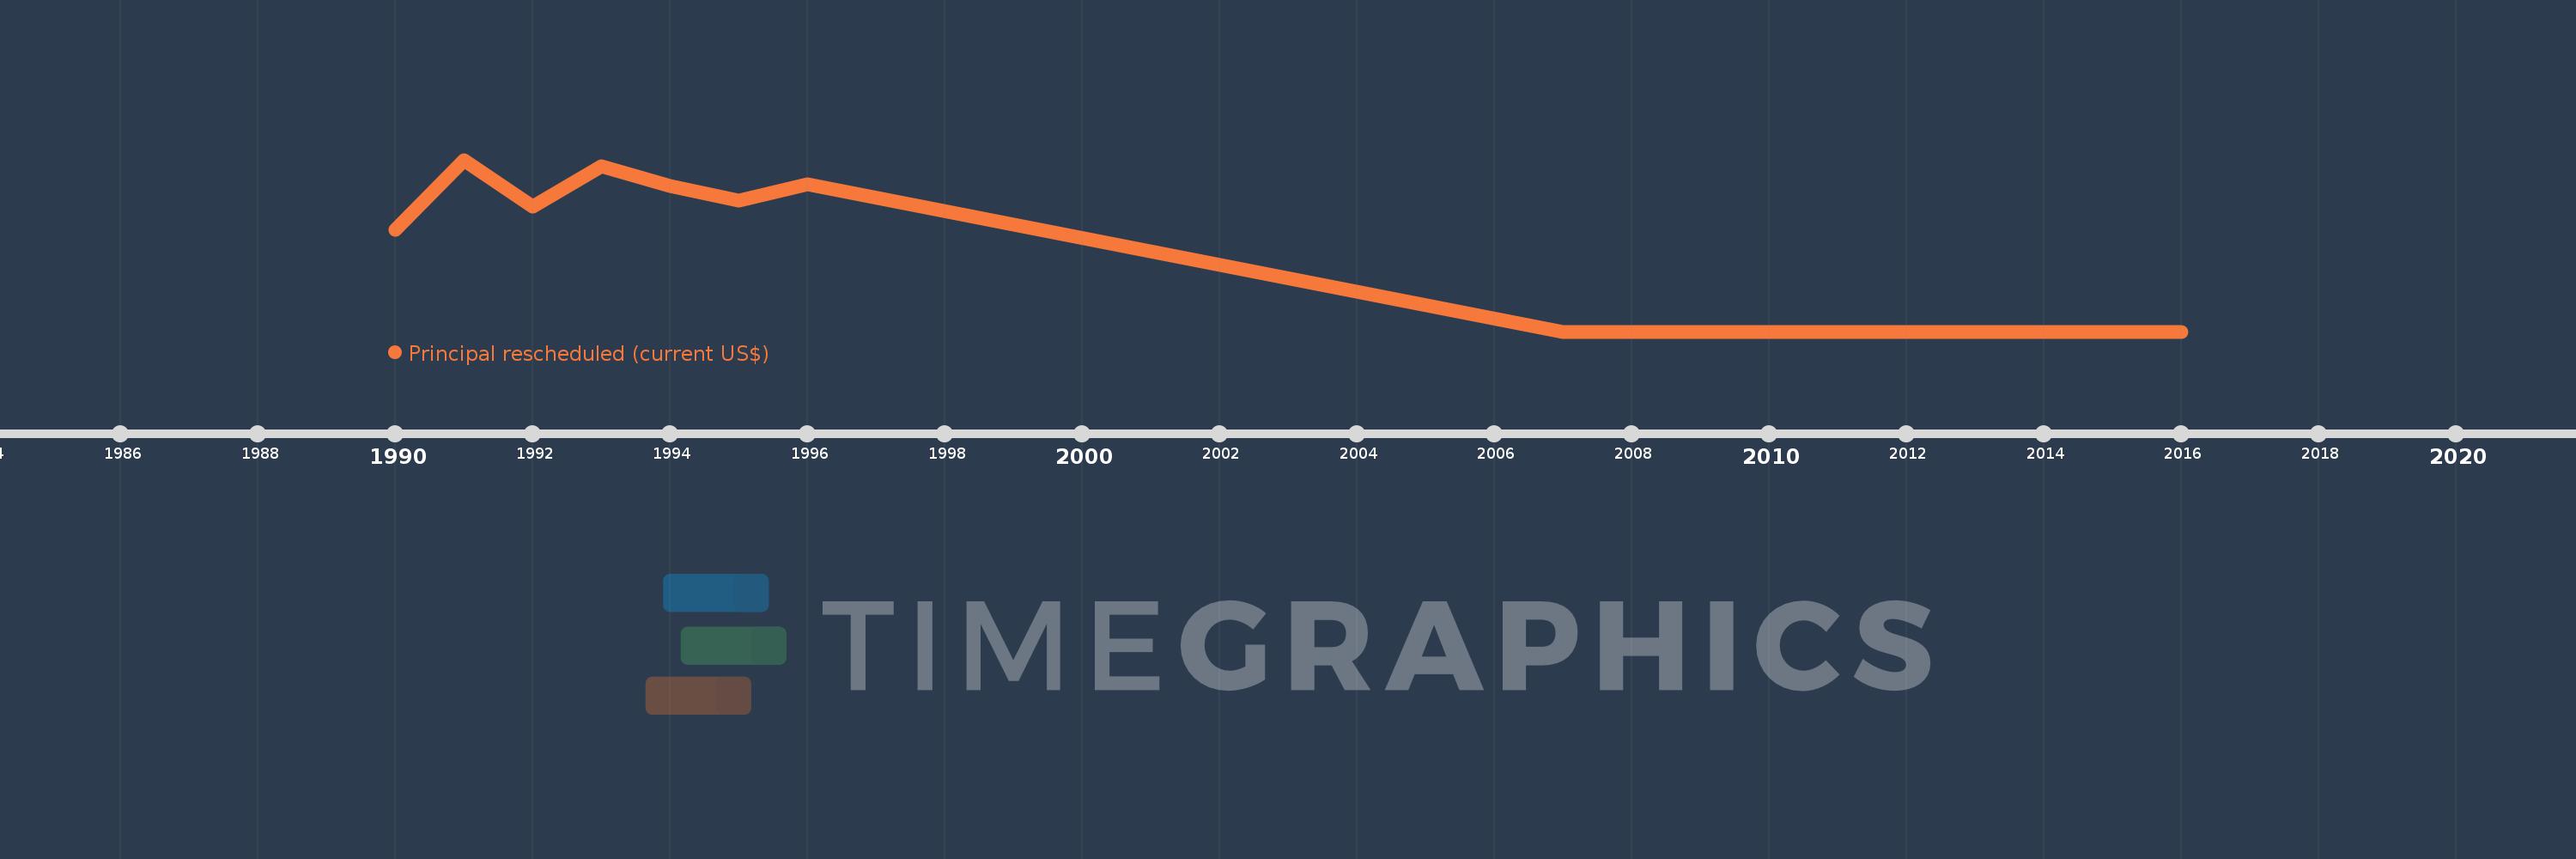
Principal rescheduled (current US$)
2016,2015,2014,2013,2012,2011,2010,2009,2007,1996,1995,1994,1993,1992,1991,1990
This statistics in other country:
Timeline:
This timeline shows a graph from 1990 to 2016 of Jamaica. No data until 1989. Number of actual observations by date: 16.
Source name:
World Development Indicators
Source organization:
World Bank, International Debt Statistics.
Categories, topics:
External Debt
Last updated:
apr 23, 2017
Indicators value changes by year
Maximum:
99.431 mln
jan 1, 1991
At the date of observation
Value
Absolute change
Change from previous value
jan 1, 1990
59.08 mln
+59.08 mln
0.0%
jan 1, 1991
99.431 mln
+40.351 mln
68.3%
jan 1, 1992
72.462 mln
-26.969 mln
-27.12%
jan 1, 1993
95.506 mln
+23.044 mln
31.8%
jan 1, 1994
84.175 mln
-11.331 mln
-11.86%
jan 1, 1995
75.609 mln
-8.566 mln
-10.18%
jan 1, 1996
85.17 mln
+9.561 mln
12.65%
jan 1, 2007
0.0
-85.17 mln
-100.0%
Ranking of countries by current statistics by years


Comments: