29
/
en
AIzaSyAYiBZKx7MnpbEhh9jyipgxe19OcubqV5w
April 1, 2024
160905
Israel
ISR
true
2
1
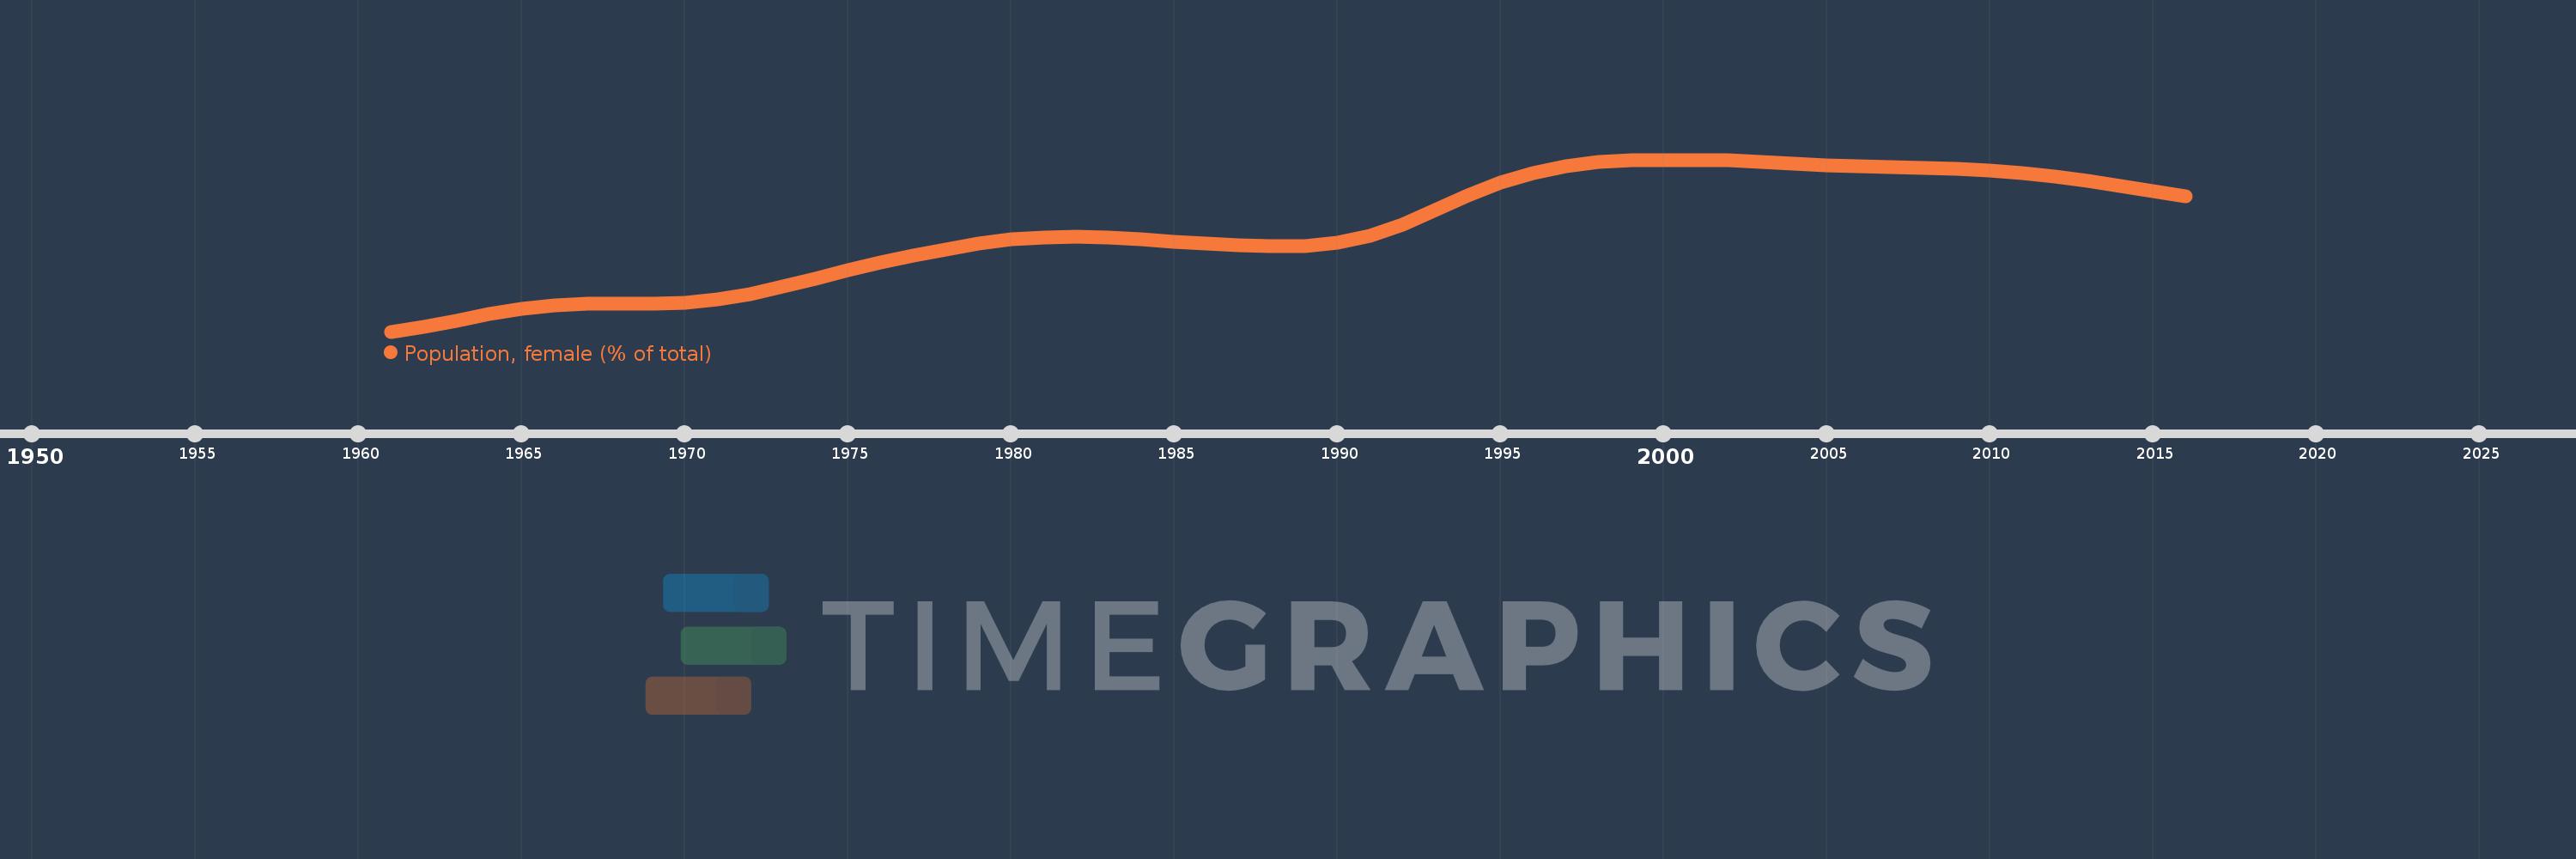
Population, female (% of total)
2016,2015,2014,2013,2012,2011,2010,2009,2008,2007,2006,2005,2004,2003,2002,2001,2000,1999,1998,1997,1996,1995,1994,1993,1992,1991,1990,1989,1988,1987,1986,1985,1984,1983,1982,1981,1980,1979,1978,1977,1976,1975,1974,1973,1972,1971,1970,1969,1968,1967,1966,1965,1964,1963,1962,1961
This statistics in other country:
AfghanistanAlbaniaAlgeriaAngolaAntigua and BarbudaArab WorldArgentinaArmeniaArubaAustraliaAustriaAzerbaijanBahamas, TheBahrainBangladeshBarbadosBelarusBelgiumBelizeBeninBhutanBoliviaBosnia and HerzegovinaBotswanaBrazilBrunei DarussalamBulgariaBurkina FasoBurundiCabo VerdeCambodiaCameroonCanadaCaribbean small statesCentral African RepublicCentral Europe and the BalticsChadChannel IslandsChileChinaColombiaComorosCongo, Dem. Rep.Congo, Rep.Costa RicaCote d'IvoireCroatiaCubaCuracaoCyprusCzech RepublicDenmarkDjiboutiDominican RepublicEarly-demographic dividendEast Asia & PacificEast Asia & Pacific (excluding high income)East Asia & Pacific (IDA & IBRD countries)EcuadorEgypt, Arab Rep.El SalvadorEquatorial GuineaEritreaEstoniaEthiopiaEuro areaEurope & Central AsiaEurope & Central Asia (excluding high income)Europe & Central Asia (IDA & IBRD countries)European UnionFijiFinlandFragile and conflict affected situationsFranceFrench PolynesiaGabonGambia, TheGeorgiaGermanyGhanaGreeceGrenadaGuamGuatemalaGuineaGuinea-BissauGuyanaHaitiHeavily indebted poor countries (HIPC)High incomeHondurasHong Kong SAR, ChinaHungaryIBRD onlyIcelandIDA & IBRD totalIDA blendIDA onlyIDA totalIndiaIndonesiaIran, Islamic Rep.IraqIrelandIsraelItalyJamaicaJapanJordanKazakhstanKenyaKiribatiKorea, Dem. People’s Rep.Korea, Rep.KosovoKuwaitKyrgyz RepublicLao PDRLate-demographic dividendLatin America & Caribbean Latin America & Caribbean (excluding high income)Latin America & the Caribbean (IDA & IBRD countries)LatviaLeast developed countries: UN classificationLebanonLesothoLiberiaLibyaLithuaniaLow & middle incomeLow incomeLower middle incomeLuxembourgMacao SAR, ChinaMacedonia, FYRMadagascarMalawiMalaysiaMaldivesMaliMaltaMauritaniaMauritiusMexicoMicronesia, Fed. Sts.Middle East & North AfricaMiddle East & North Africa (excluding high income)Middle East & North Africa (IDA & IBRD countries)Middle incomeMoldovaMongoliaMontenegroMoroccoMozambiqueMyanmarNamibiaNepalNetherlandsNew CaledoniaNew ZealandNicaraguaNigerNigeriaNorth AmericaNorwayOECD membersOmanOther small statesPacific island small statesPakistanPanamaPapua New GuineaParaguayPeruPhilippinesPolandPortugalPost-demographic dividendPre-demographic dividendPuerto RicoQatarRomaniaRussian FederationRwandaSamoaSao Tome and PrincipeSaudi ArabiaSenegalSerbiaSeychellesSierra LeoneSingaporeSlovak RepublicSloveniaSmall statesSolomon IslandsSomaliaSouth AfricaSouth AsiaSouth Asia (IDA & IBRD)South SudanSpainSri LankaSt. LuciaSt. Vincent and the GrenadinesSub-Saharan Africa Sub-Saharan Africa (excluding high income)Sub-Saharan Africa (IDA & IBRD countries)SudanSurinameSwazilandSwedenSwitzerlandSyrian Arab RepublicTajikistanTanzaniaThailandTimor-LesteTogoTongaTrinidad and TobagoTunisiaTurkeyTurkmenistanUgandaUkraineUnited Arab EmiratesUnited KingdomUnited StatesUpper middle incomeUruguayUzbekistanVanuatuVenezuela, RBVietnamVirgin Islands (U.S.)West Bank and GazaWorldYemen, Rep.ZambiaZimbabwe Timeline:
This timeline shows a graph from 1961 to 2016 of Israel. No data until 1960. Number of actual observations by date: 56.
Source name:
World Development Indicators
Source organization:
World Bank staff estimates based on male/female distributions of United Nations Population Division's World Population Prospects.
Categories, topics:
Health
Last updated:
apr 23, 2017
Indicators value changes by year
Minimum:
49.295
jan 1, 1961
Maximum:
50.718
jan 1, 2001
At the date of observation
Value
Absolute change
Change from previous value
jan 1, 1961
49.295
+49.295
0.0%
jan 1, 1962
49.335
+0.04
0.08%
jan 1, 1963
49.387
+0.051
0.1%
jan 1, 1964
49.44
+0.053
0.11%
jan 1, 1965
49.483
+0.043
0.09%
jan 1, 1966
49.511
+0.028
0.06%
jan 1, 1967
49.523
+0.012
0.02%
jan 1, 1968
49.524
+0.001
0.0%
jan 1, 1969
49.523
-0.001
0.0%
jan 1, 1970
49.533
+0.01
0.02%
jan 1, 1971
49.562
+0.028
0.06%
jan 1, 1972
49.608
+0.047
0.09%
jan 1, 1973
49.669
+0.06
0.12%
jan 1, 1974
49.736
+0.067
0.14%
jan 1, 1975
49.803
+0.067
0.13%
jan 1, 1976
49.865
+0.062
0.12%
jan 1, 1977
49.923
+0.058
0.12%
jan 1, 1978
49.977
+0.054
0.11%
jan 1, 1979
50.024
+0.047
0.09%
jan 1, 1980
50.058
+0.034
0.07%
jan 1, 1981
50.076
+0.019
0.04%
jan 1, 1982
50.08
+0.004
0.01%
jan 1, 1983
50.072
-0.008
-0.02%
jan 1, 1984
50.057
-0.016
-0.03%
jan 1, 1985
50.039
-0.017
-0.03%
jan 1, 1986
50.025
-0.014
-0.03%
jan 1, 1987
50.012
-0.013
-0.03%
jan 1, 1988
50.001
-0.011
-0.02%
jan 1, 1989
50.003
+0.002
0.0%
jan 1, 1990
50.031
+0.028
0.06%
jan 1, 1991
50.091
+0.06
0.12%
jan 1, 1992
50.184
+0.093
0.19%
jan 1, 1993
50.301
+0.116
0.23%
jan 1, 1994
50.423
+0.122
0.24%
jan 1, 1995
50.53
+0.107
0.21%
jan 1, 1996
50.611
+0.081
0.16%
jan 1, 1997
50.665
+0.054
0.11%
jan 1, 1998
50.697
+0.032
0.06%
jan 1, 1999
50.712
+0.015
0.03%
jan 1, 2000
50.718
+0.005
0.01%
jan 1, 2001
50.718
+0.0
0.0%
jan 1, 2002
50.713
-0.005
-0.01%
jan 1, 2003
50.702
-0.011
-0.02%
jan 1, 2004
50.687
-0.014
-0.03%
jan 1, 2005
50.673
-0.014
-0.03%
jan 1, 2006
50.662
-0.012
-0.02%
jan 1, 2007
50.654
-0.008
-0.02%
jan 1, 2008
50.648
-0.005
-0.01%
jan 1, 2009
50.642
-0.006
-0.01%
jan 1, 2010
50.63
-0.012
-0.02%
jan 1, 2011
50.609
-0.021
-0.04%
jan 1, 2012
50.579
-0.03
-0.06%
jan 1, 2013
50.541
-0.038
-0.07%
jan 1, 2014
50.499
-0.042
-0.08%
jan 1, 2015
50.456
-0.043
-0.09%
jan 1, 2016
50.414
-0.042
-0.08%
Ranking of countries by current statistics by years


Comments: