29
/
en
AIzaSyAYiBZKx7MnpbEhh9jyipgxe19OcubqV5w
April 1, 2024
159730
Ireland
IRL
true
2
1
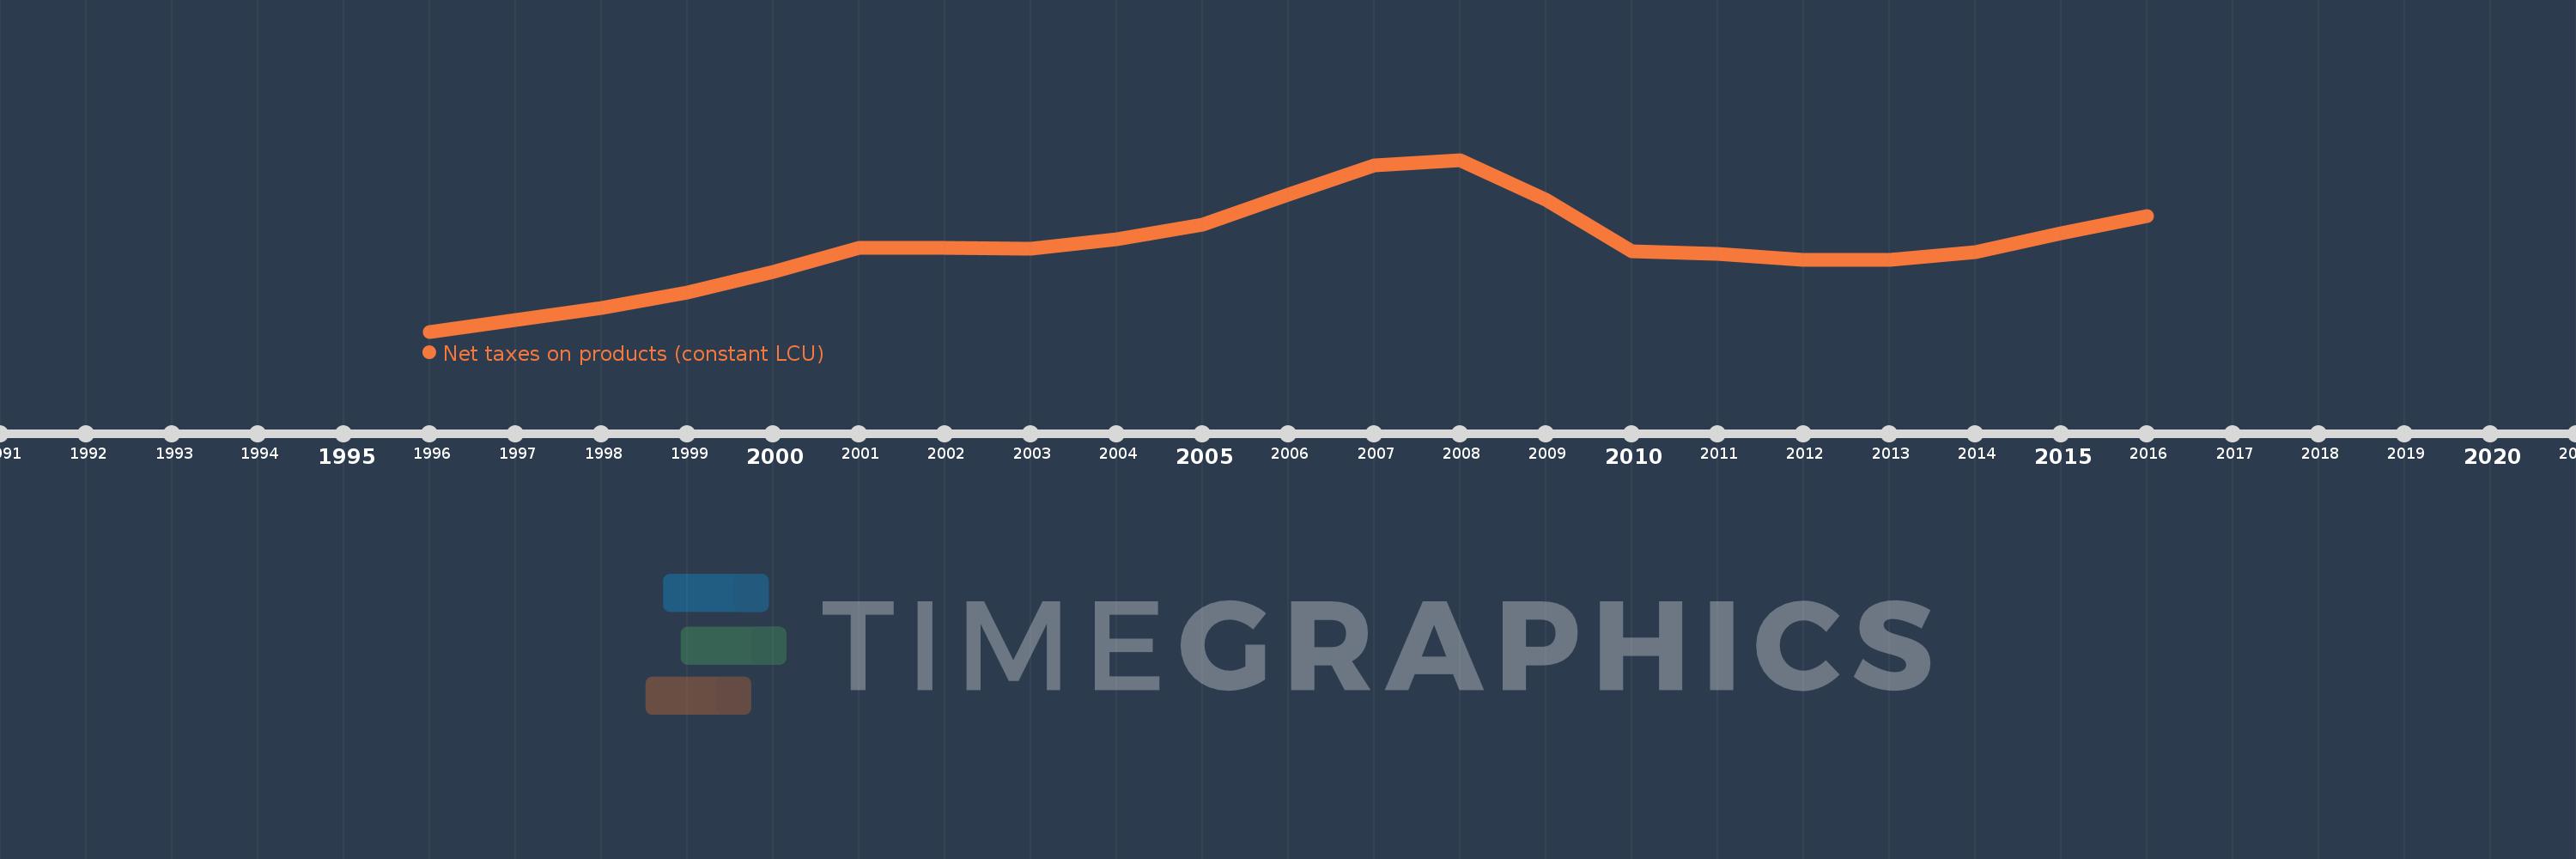
Net taxes on products (constant LCU)
2016,2015,2014,2013,2012,2011,2010,2009,2008,2007,2006,2005,2004,2003,2002,2001,2000,1999,1998,1997,1996
This statistics in other country:
Timeline:
This timeline shows a graph from 1996 to 2016 of Ireland. No data until 1995. Number of actual observations by date: 21.
Source name:
World Development Indicators
Source organization:
World Bank national accounts data, and OECD National Accounts data files.
Categories, topics:
Economy & Growth
Last updated:
apr 23, 2017
Indicators value changes by year
Minimum:
9.22 bln
jan 1, 1996
Maximum:
22.486 bln
jan 1, 2008
At the date of observation
Value
Absolute change
Change from previous value
jan 1, 1996
9.22 bln
+9.22 bln
0.0%
jan 1, 1997
10.099 bln
+879.196 mln
9.54%
jan 1, 1998
11.072 bln
+972.495 mln
9.63%
jan 1, 1999
12.228 bln
+1.157 bln
10.45%
jan 1, 2000
13.854 bln
+1.626 bln
13.3%
jan 1, 2001
15.693 bln
+1.839 bln
13.27%
jan 1, 2002
15.663 bln
-29.875 mln
-0.19%
jan 1, 2003
15.631 bln
-32.116 mln
-0.21%
jan 1, 2004
16.354 bln
+723.204 mln
4.63%
jan 1, 2005
17.483 bln
+1.128 bln
6.9%
jan 1, 2006
19.797 bln
+2.314 bln
13.24%
jan 1, 2007
22.071 bln
+2.274 bln
11.49%
jan 1, 2008
22.486 bln
+414.885 mln
1.88%
jan 1, 2009
19.433 bln
-3.053 bln
-13.58%
jan 1, 2010
15.426 bln
-4.006 bln
-20.62%
jan 1, 2011
15.201 bln
-225.408 mln
-1.46%
jan 1, 2012
14.786 bln
-414.547 mln
-2.73%
jan 1, 2013
14.766 bln
-20.018 mln
-0.14%
jan 1, 2014
15.361 bln
+595.178 mln
4.03%
jan 1, 2015
16.83 bln
+1.468 bln
9.56%
jan 1, 2016
18.156 bln
+1.326 bln
7.88%
Ranking of countries by current statistics by years


Comments: