29
/
en
AIzaSyAYiBZKx7MnpbEhh9jyipgxe19OcubqV5w
April 1, 2024
157047
Iran, Islamic Rep.
IRN
true
2
1
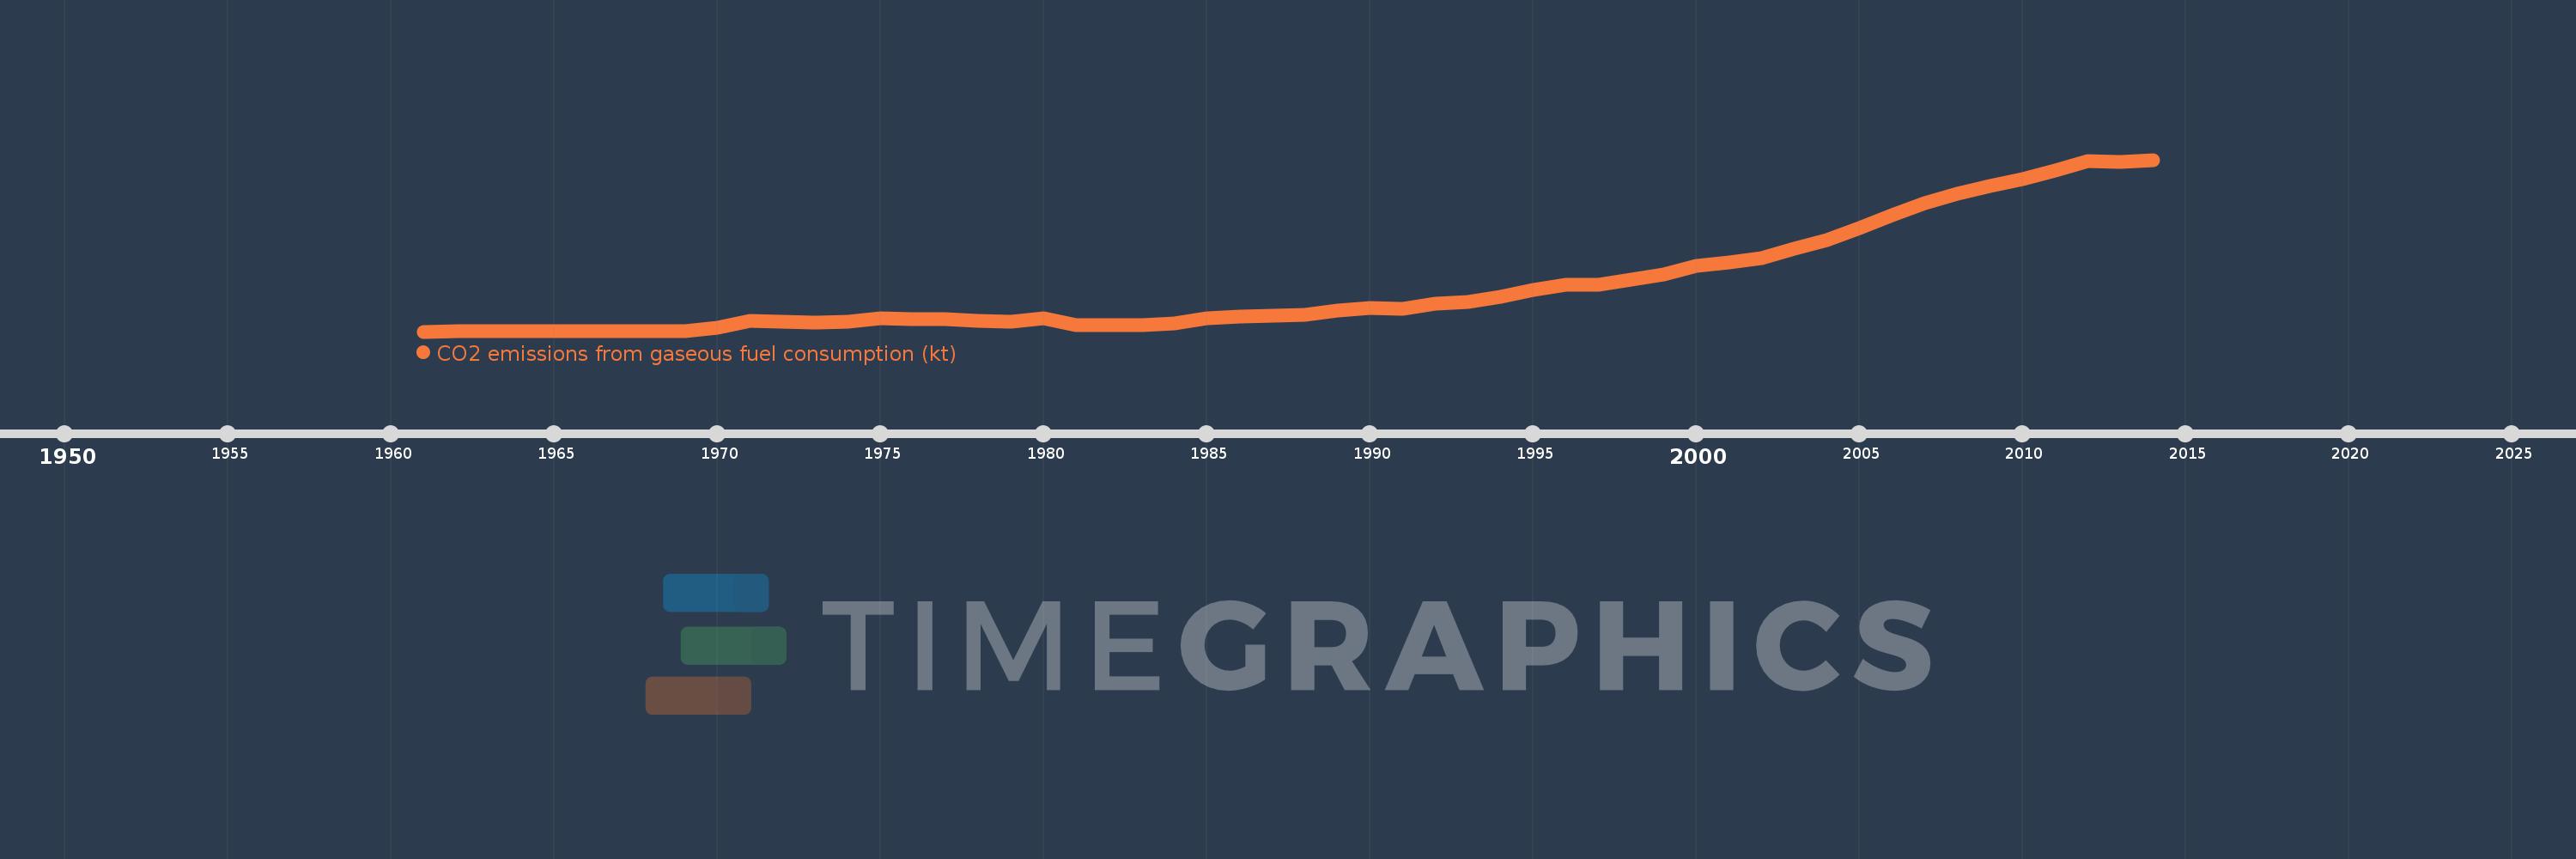
CO2 emissions from gaseous fuel consumption (kt)
2014,2013,2012,2011,2010,2009,2008,2007,2006,2005,2004,2003,2002,2001,2000,1999,1998,1997,1996,1995,1994,1993,1992,1991,1990,1989,1988,1987,1986,1985,1984,1983,1982,1981,1980,1979,1978,1977,1976,1975,1974,1973,1972,1971,1970,1969,1968,1967,1966,1965,1964,1963,1962,1961
This statistics in other country:
AfghanistanAlbaniaAlgeriaAndorraAngolaAntigua and BarbudaArab WorldArgentinaArmeniaArubaAustraliaAustriaAzerbaijanBahamas, TheBahrainBangladeshBarbadosBelarusBelgiumBelizeBeninBermudaBhutanBoliviaBosnia and HerzegovinaBotswanaBrazilBritish Virgin IslandsBrunei DarussalamBulgariaBurkina FasoBurundiCabo VerdeCambodiaCameroonCanadaCayman IslandsCentral African RepublicCentral Europe and the BalticsChadChileChinaColombiaComorosCongo, Dem. Rep.Congo, Rep.Costa RicaCote d'IvoireCroatiaCubaCuracaoCyprusCzech RepublicDenmarkDjiboutiDominicaDominican RepublicEarly-demographic dividendEast Asia & PacificEast Asia & Pacific (excluding high income)East Asia & Pacific (IDA & IBRD countries)EcuadorEgypt, Arab Rep.El SalvadorEquatorial GuineaEritreaEstoniaEthiopiaEuro areaEurope & Central AsiaEurope & Central Asia (excluding high income)Europe & Central Asia (IDA & IBRD countries)European UnionFaroe IslandsFijiFinlandFragile and conflict affected situationsFranceFrench PolynesiaGabonGambia, TheGeorgiaGermanyGhanaGibraltarGreeceGreenlandGrenadaGuatemalaGuineaGuinea-BissauGuyanaHaitiHigh incomeHondurasHong Kong SAR, ChinaHungaryIBRD onlyIcelandIDA & IBRD totalIDA blendIDA totalIndiaIndonesiaIran, Islamic Rep.IraqIrelandIsraelItalyJamaicaJapanJordanKazakhstanKenyaKiribatiKorea, Dem. People’s Rep.Korea, Rep.KuwaitKyrgyz RepublicLao PDRLate-demographic dividendLatin America & Caribbean Latin America & Caribbean (excluding high income)Latin America & the Caribbean (IDA & IBRD countries)LatviaLebanonLesothoLiberiaLibyaLiechtensteinLithuaniaLow & middle incomeLower middle incomeLuxembourgMacao SAR, ChinaMacedonia, FYRMadagascarMalawiMalaysiaMaldivesMaliMaltaMarshall IslandsMauritaniaMauritiusMexicoMicronesia, Fed. Sts.Middle East & North AfricaMiddle East & North Africa (excluding high income)Middle East & North Africa (IDA & IBRD countries)Middle incomeMoldovaMongoliaMontenegroMoroccoMozambiqueMyanmarNamibiaNauruNepalNetherlandsNew CaledoniaNew ZealandNicaraguaNigerNigeriaNorth AmericaNorwayOECD membersOmanPakistanPalauPanamaPapua New GuineaParaguayPeruPhilippinesPolandPortugalPost-demographic dividendPre-demographic dividendQatarRomaniaRussian FederationRwandaSamoaSao Tome and PrincipeSaudi ArabiaSenegalSerbiaSeychellesSierra LeoneSingaporeSint Maarten (Dutch part)Slovak RepublicSloveniaSolomon IslandsSomaliaSouth AfricaSouth AsiaSouth Asia (IDA & IBRD)South SudanSpainSri LankaSt. Kitts and NevisSt. LuciaSt. Vincent and the GrenadinesSub-Saharan Africa Sub-Saharan Africa (excluding high income)Sub-Saharan Africa (IDA & IBRD countries)SudanSurinameSwazilandSwedenSwitzerlandSyrian Arab RepublicTajikistanTanzaniaThailandTimor-LesteTogoTongaTrinidad and TobagoTunisiaTurkeyTurkmenistanTurks and Caicos IslandsUgandaUkraineUnited Arab EmiratesUnited KingdomUnited StatesUpper middle incomeUruguayUzbekistanVanuatuVenezuela, RBVietnamWest Bank and GazaWorldYemen, Rep.ZambiaZimbabwe Timeline:
This timeline shows a graph from 1961 to 2014 of Iran, Islamic Rep.. No data until 1960. Number of actual observations by date: 54.
Source name:
World Development Indicators
Source organization:
Carbon Dioxide Information Analysis Center, Environmental Sciences Division, Oak Ridge National Laboratory, Tennessee, United States.
Categories, topics:
Climate Change, Environment
Last updated:
apr 23, 2017
Indicators value changes by year
Minimum:
1.841K
jan 1, 1961
Maximum:
295.175K
jan 1, 2014
At the date of observation
Value
Absolute change
Change from previous value
jan 1, 1961
1.841K
+1.841K
0.0%
jan 1, 1962
1.903K
+62.339
3.39%
jan 1, 1963
2.039K
+135.679
7.13%
jan 1, 1964
2.208K
+168.682
8.27%
jan 1, 1965
2.31K
+102.676
4.65%
jan 1, 1966
2.38K
+69.673
3.02%
jan 1, 1967
2.684K
+304.361
12.79%
jan 1, 1968
2.842K
+157.681
5.87%
jan 1, 1969
3.04K
+198.018
6.97%
jan 1, 1970
9.028K
+5.988K
196.98%
jan 1, 1971
20.576K
+11.547K
127.9%
jan 1, 1972
18.042K
-2.534K
-12.32%
jan 1, 1973
17.481K
-561.051
-3.11%
jan 1, 1974
19.204K
+1.723K
9.86%
jan 1, 1975
24.195K
+4.991K
25.99%
jan 1, 1976
22.908K
-1.287K
-5.32%
jan 1, 1977
22.853K
-55.005
-0.24%
jan 1, 1978
20.462K
-2.391K
-10.46%
jan 1, 1979
18.848K
-1.613K
-7.89%
jan 1, 1980
24.07K
+5.222K
27.7%
jan 1, 1981
13.293K
-10.777K
-44.77%
jan 1, 1982
12.152K
-1.14K
-8.58%
jan 1, 1983
12.636K
+484.044
3.98%
jan 1, 1984
16.047K
+3.41K
26.99%
jan 1, 1985
25.159K
+9.112K
56.79%
jan 1, 1986
27.414K
+2.255K
8.96%
jan 1, 1987
28.566K
+1.151K
4.2%
jan 1, 1988
30.627K
+2.061K
7.21%
jan 1, 1989
38.426K
+7.8K
25.47%
jan 1, 1990
42.625K
+4.199K
10.93%
jan 1, 1991
40.047K
-2.578K
-6.05%
jan 1, 1992
49.659K
+9.611K
24.0%
jan 1, 1993
52.691K
+3.033K
6.11%
jan 1, 1994
60.74K
+8.049K
15.28%
jan 1, 1995
73.347K
+12.607K
20.76%
jan 1, 1996
81.642K
+8.295K
11.31%
jan 1, 1997
81.312K
-330.03
-0.4%
jan 1, 1998
90.989K
+9.677K
11.9%
jan 1, 1999
98.734K
+7.745K
8.51%
jan 1, 2000
114.381K
+15.647K
15.85%
jan 1, 2001
120.545K
+6.164K
5.39%
jan 1, 2002
127.758K
+7.213K
5.98%
jan 1, 2003
143.933K
+16.175K
12.66%
jan 1, 2004
158.598K
+14.664K
10.19%
jan 1, 2005
179.045K
+20.447K
12.89%
jan 1, 2006
200.325K
+21.28K
11.89%
jan 1, 2007
221.721K
+21.397K
10.68%
jan 1, 2008
236.712K
+14.991K
6.76%
jan 1, 2009
250.1K
+13.388K
5.66%
jan 1, 2010
262.216K
+12.116K
4.84%
jan 1, 2011
277.449K
+15.233K
5.81%
jan 1, 2012
293.51K
+16.061K
5.79%
jan 1, 2013
291.482K
-2.028K
-0.69%
jan 1, 2014
295.175K
+3.693K
1.27%
Ranking of countries by current statistics by years


Comments: