29
/
en
AIzaSyAYiBZKx7MnpbEhh9jyipgxe19OcubqV5w
April 1, 2024
152889
Hungary
HUN
true
2
1
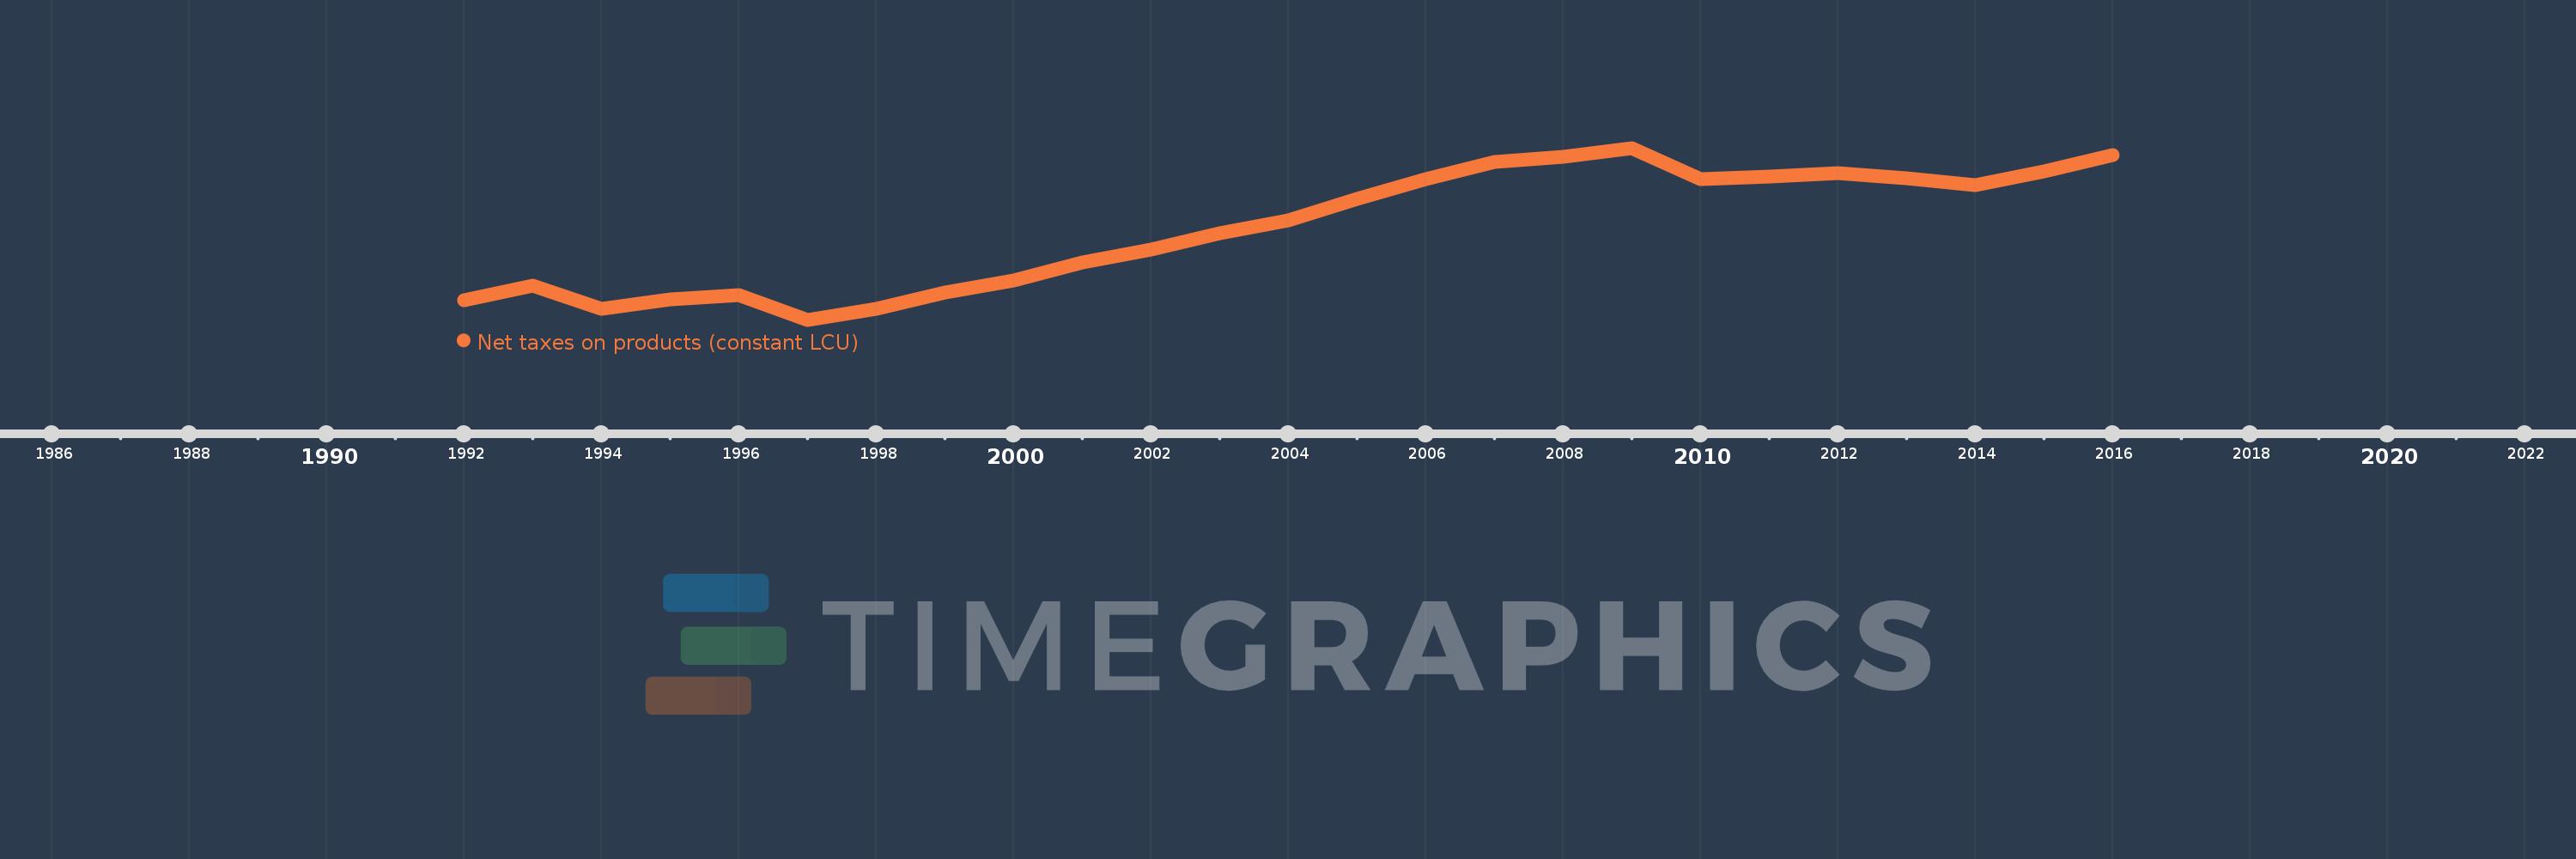
Net taxes on products (constant LCU)
2016,2015,2014,2013,2012,2011,2010,2009,2008,2007,2006,2005,2004,2003,2002,2001,2000,1999,1998,1997,1996,1995,1994,1993,1992
This statistics in other country:
Timeline:
This timeline shows a graph from 1992 to 2016 of Hungary. No data until 1991. Number of actual observations by date: 25.
Source name:
World Development Indicators
Source organization:
World Bank national accounts data, and OECD National Accounts data files.
Categories, topics:
Economy & Growth
Last updated:
apr 23, 2017
Indicators value changes by year
Minimum:
2.881 trl
jan 1, 1997
Maximum:
4.432 trl
jan 1, 2009
At the date of observation
Value
Absolute change
Change from previous value
jan 1, 1992
3.06 trl
+3.06 trl
0.0%
jan 1, 1993
3.188 trl
+127.586 bln
4.17%
jan 1, 1994
2.979 trl
-208.799 bln
-6.55%
jan 1, 1995
3.067 trl
+87.801 bln
2.95%
jan 1, 1996
3.101 trl
+33.895 bln
1.11%
jan 1, 1997
2.881 trl
-219.949 bln
-7.09%
jan 1, 1998
2.983 trl
+101.724 bln
3.53%
jan 1, 1999
3.127 trl
+144.074 bln
4.83%
jan 1, 2000
3.239 trl
+112.241 bln
3.59%
jan 1, 2001
3.401 trl
+162.069 bln
5.0%
jan 1, 2002
3.512 trl
+111.182 bln
3.27%
jan 1, 2003
3.66 trl
+148.366 bln
4.22%
jan 1, 2004
3.776 trl
+115.834 bln
3.16%
jan 1, 2005
3.974 trl
+197.259 bln
5.22%
jan 1, 2006
4.152 trl
+178.505 bln
4.49%
jan 1, 2007
4.305 trl
+152.599 bln
3.68%
jan 1, 2008
4.35 trl
+45.028 bln
1.05%
jan 1, 2009
4.432 trl
+82.516 bln
1.9%
jan 1, 2010
4.152 trl
-280.514 bln
-6.33%
jan 1, 2011
4.171 trl
+18.901 bln
0.46%
jan 1, 2012
4.203 trl
+32.65 bln
0.78%
jan 1, 2013
4.156 trl
-47.331 bln
-1.13%
jan 1, 2014
4.097 trl
-59.003 bln
-1.42%
jan 1, 2015
4.22 trl
+123.264 bln
3.01%
jan 1, 2016
4.366 trl
+145.473 bln
3.45%
Ranking of countries by current statistics by years


Comments: