29
/
en
AIzaSyAYiBZKx7MnpbEhh9jyipgxe19OcubqV5w
April 1, 2024
149494
Haiti
HTI
true
2
1
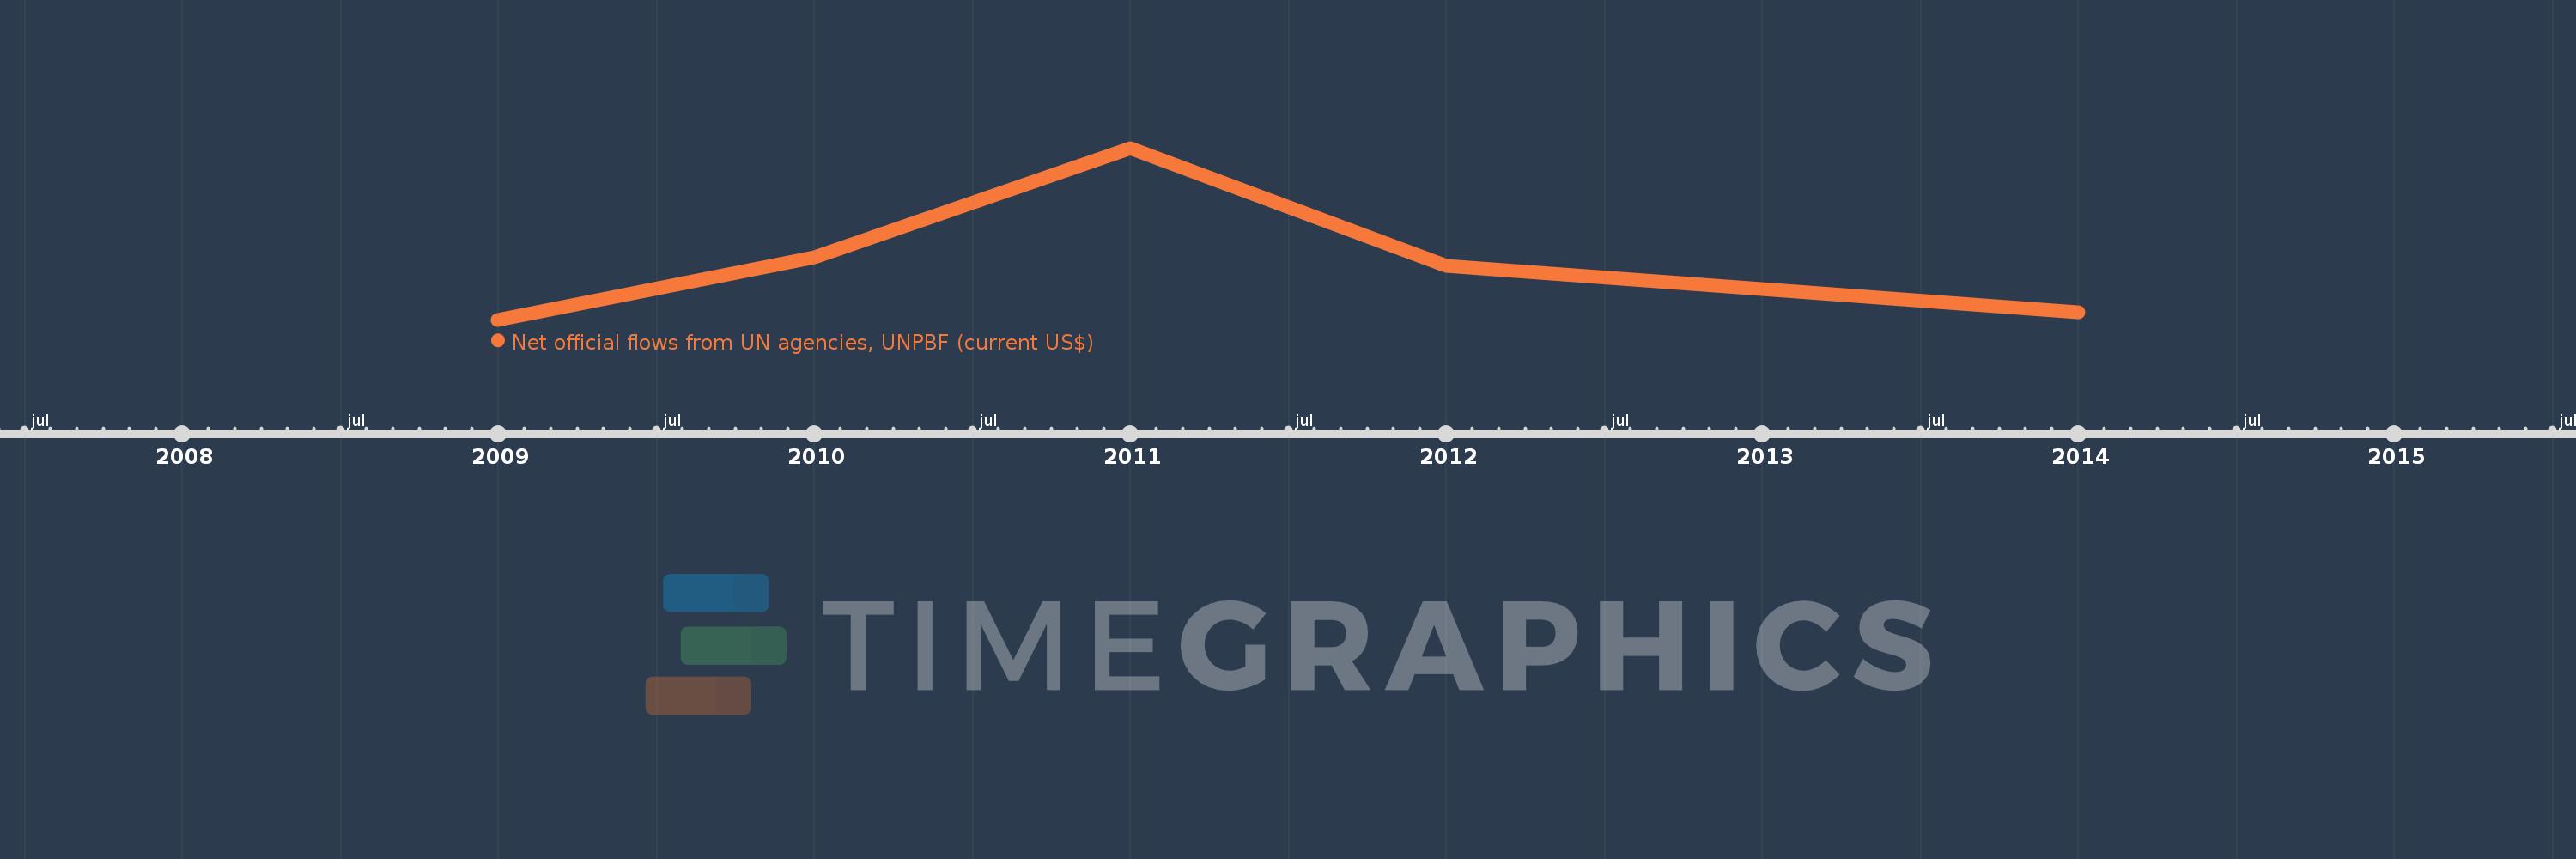
Net official flows from UN agencies, UNPBF (current US$)
2014,2012,2011,2010,2009
This statistics in other country:
Timeline:
This timeline shows a graph from 2009 to 2014 of Haiti. No data until 2008. Number of actual observations by date: 5.
Source name:
World Development Indicators
Source organization:
Development Assistance Committee of the Organisation for Economic Co-operation and Development, Geographical Distribution of Financial Flows to Developing Countries, Development Co-operation Report, and International Development Statistics database. Data are available online at: www.oecd.org/dac/stats/idsonline.
Categories, topics:
Aid Effectiveness
Last updated:
apr 23, 2017
Indicators value changes by year
Minimum:
-90.0K
jan 1, 2009
Maximum:
2.33 mln
jan 1, 2011
At the date of observation
Value
Absolute change
Change from previous value
jan 1, 2009
-90.0K
-90.0K
0.0%
jan 1, 2010
790.0K
+880.0K
-977.78%
jan 1, 2011
2.33 mln
+1.54 mln
194.94%
jan 1, 2012
670.0K
-1.66 mln
-71.24%
jan 1, 2014
20.0K
-650.0K
-97.01%
Ranking of countries by current statistics by years


Comments: