29
/
en
AIzaSyAYiBZKx7MnpbEhh9jyipgxe19OcubqV5w
April 1, 2024
146057
Guinea
GIN
true
2
1
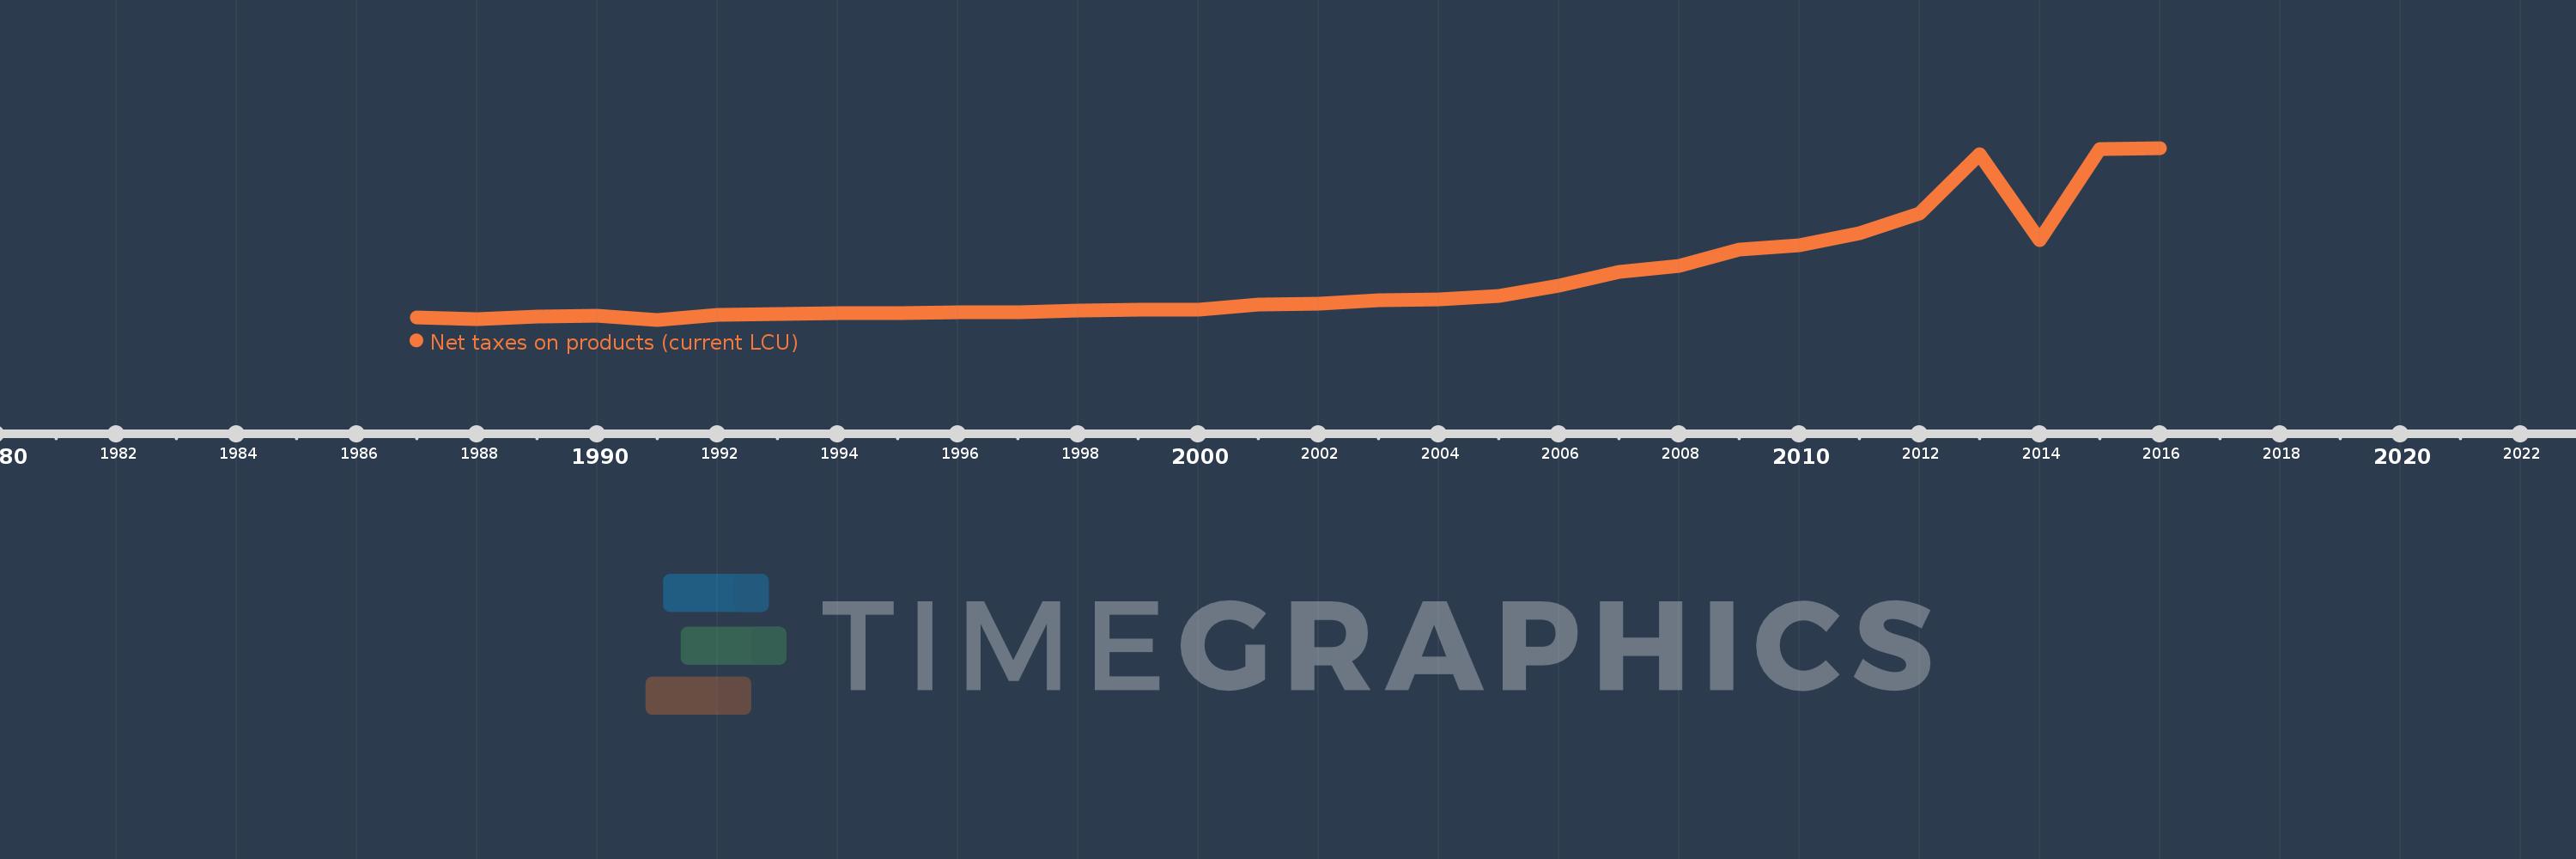
Net taxes on products (current LCU)
2016,2015,2014,2013,2012,2011,2010,2009,2008,2007,2006,2005,2004,2003,2002,2001,2000,1999,1998,1997,1996,1995,1994,1993,1992,1991,1990,1989,1988,1987
This statistics in other country:
AfghanistanAlbaniaAlgeriaAndorraAntigua and BarbudaArgentinaArmeniaArubaAustraliaAustriaAzerbaijanBahamas, TheBahrainBangladeshBarbadosBelarusBelgiumBelizeBeninBermudaBhutanBoliviaBosnia and HerzegovinaBotswanaBrazilBulgariaBurkina FasoBurundiCabo VerdeCambodiaCameroonCanadaCentral African RepublicChadChileColombiaCongo, Dem. Rep.Costa RicaCroatiaCubaCyprusCzech RepublicDenmarkDjiboutiDominicaDominican RepublicEcuadorEgypt, Arab Rep.El SalvadorEquatorial GuineaEritreaEstoniaEthiopiaFaroe IslandsFijiFinlandFranceGabonGambia, TheGeorgiaGermanyGhanaGreeceGrenadaGuatemalaGuineaGuinea-BissauGuyanaHondurasHong Kong SAR, ChinaHungaryIndiaIndonesiaIran, Islamic Rep.IrelandItalyJamaicaJapanJordanKazakhstanKenyaKiribatiKorea, Rep.KosovoKyrgyz RepublicLao PDRLatviaLebanonLesothoLiberiaLiechtensteinLithuaniaLuxembourgMacao SAR, ChinaMacedonia, FYRMadagascarMalawiMalaysiaMaldivesMaliMarshall IslandsMauritaniaMauritiusMexicoMicronesia, Fed. Sts.MoldovaMongoliaMontenegroMoroccoMozambiqueNamibiaNepalNetherlandsNew ZealandNicaraguaNigerNigeriaNorwayOmanPakistanPalauPanamaPapua New GuineaParaguayPeruPolandPortugalRomaniaRussian FederationRwandaSao Tome and PrincipeSenegalSerbiaSeychellesSierra LeoneSingaporeSlovak RepublicSloveniaSolomon IslandsSomaliaSouth AfricaSpainSri LankaSt. Kitts and NevisSt. LuciaSt. Vincent and the GrenadinesSudanSurinameSwazilandSwedenSwitzerlandSyrian Arab RepublicTajikistanTanzaniaThailandTimor-LesteTongaTrinidad and TobagoTunisiaTurkeyTurkmenistanTuvaluUgandaUkraineUnited KingdomUnited StatesUruguayUzbekistanVanuatuVenezuela, RBVietnamWest Bank and GazaYemen, Rep.ZambiaZimbabwe Timeline:
This timeline shows a graph from 1987 to 2016 of Guinea. No data until 1986. Number of actual observations by date: 30.
Source name:
World Development Indicators
Source organization:
World Bank national accounts data, and OECD National Accounts data files.
Categories, topics:
Economy & Growth
Last updated:
apr 23, 2017
Indicators value changes by year
Minimum:
-67.479 bln
jan 1, 1991
Maximum:
4.451 trl
jan 1, 2016
At the date of observation
Value
Absolute change
Change from previous value
jan 1, 1987
4.0 bln
+4.0 bln
0.0%
jan 1, 1988
-54.874 bln
-58.874 bln
-1.47K%
jan 1, 1989
9.3 bln
+64.174 bln
-116.95%
jan 1, 1990
29.8 bln
+20.5 bln
220.43%
jan 1, 1991
-67.479 bln
-97.279 bln
-326.44%
jan 1, 1992
70.55 bln
+138.029 bln
-204.55%
jan 1, 1993
89.93 bln
+19.38 bln
27.47%
jan 1, 1994
103.99 bln
+14.06 bln
15.63%
jan 1, 1995
111.6 bln
+7.61 bln
7.32%
jan 1, 1996
136.9 bln
+25.3 bln
22.67%
jan 1, 1997
133.9 bln
-3.0 bln
-2.19%
jan 1, 1998
181.08 bln
+47.18 bln
35.24%
jan 1, 1999
190.27 bln
+9.19 bln
5.08%
jan 1, 2000
207.3 bln
+17.03 bln
8.95%
jan 1, 2001
325.88 bln
+118.58 bln
57.2%
jan 1, 2002
353.43 bln
+27.55 bln
8.45%
jan 1, 2003
444.81 bln
+91.38 bln
25.86%
jan 1, 2004
474.566 bln
+29.756 bln
6.69%
jan 1, 2005
565.496 bln
+90.93 bln
19.16%
jan 1, 2006
831.676 bln
+266.18 bln
47.07%
jan 1, 2007
1.202 trl
+370.092 bln
44.5%
jan 1, 2008
1.348 trl
+146.152 bln
12.16%
jan 1, 2009
1.774 trl
+426.35 bln
31.63%
jan 1, 2010
1.902 trl
+127.77 bln
7.2%
jan 1, 2011
2.212 trl
+309.534 bln
16.27%
jan 1, 2012
2.736 trl
+524.466 bln
23.71%
jan 1, 2013
4.289 trl
+1.553 trl
56.75%
jan 1, 2014
2.035 trl
-2.254 trl
-52.55%
jan 1, 2015
4.417 trl
+2.382 trl
117.05%
jan 1, 2016
4.451 trl
+34.0 bln
0.77%
Ranking of countries by current statistics by years


Comments: