29
/
en
AIzaSyAYiBZKx7MnpbEhh9jyipgxe19OcubqV5w
April 1, 2024
145623
Guinea
GIN
true
2
1
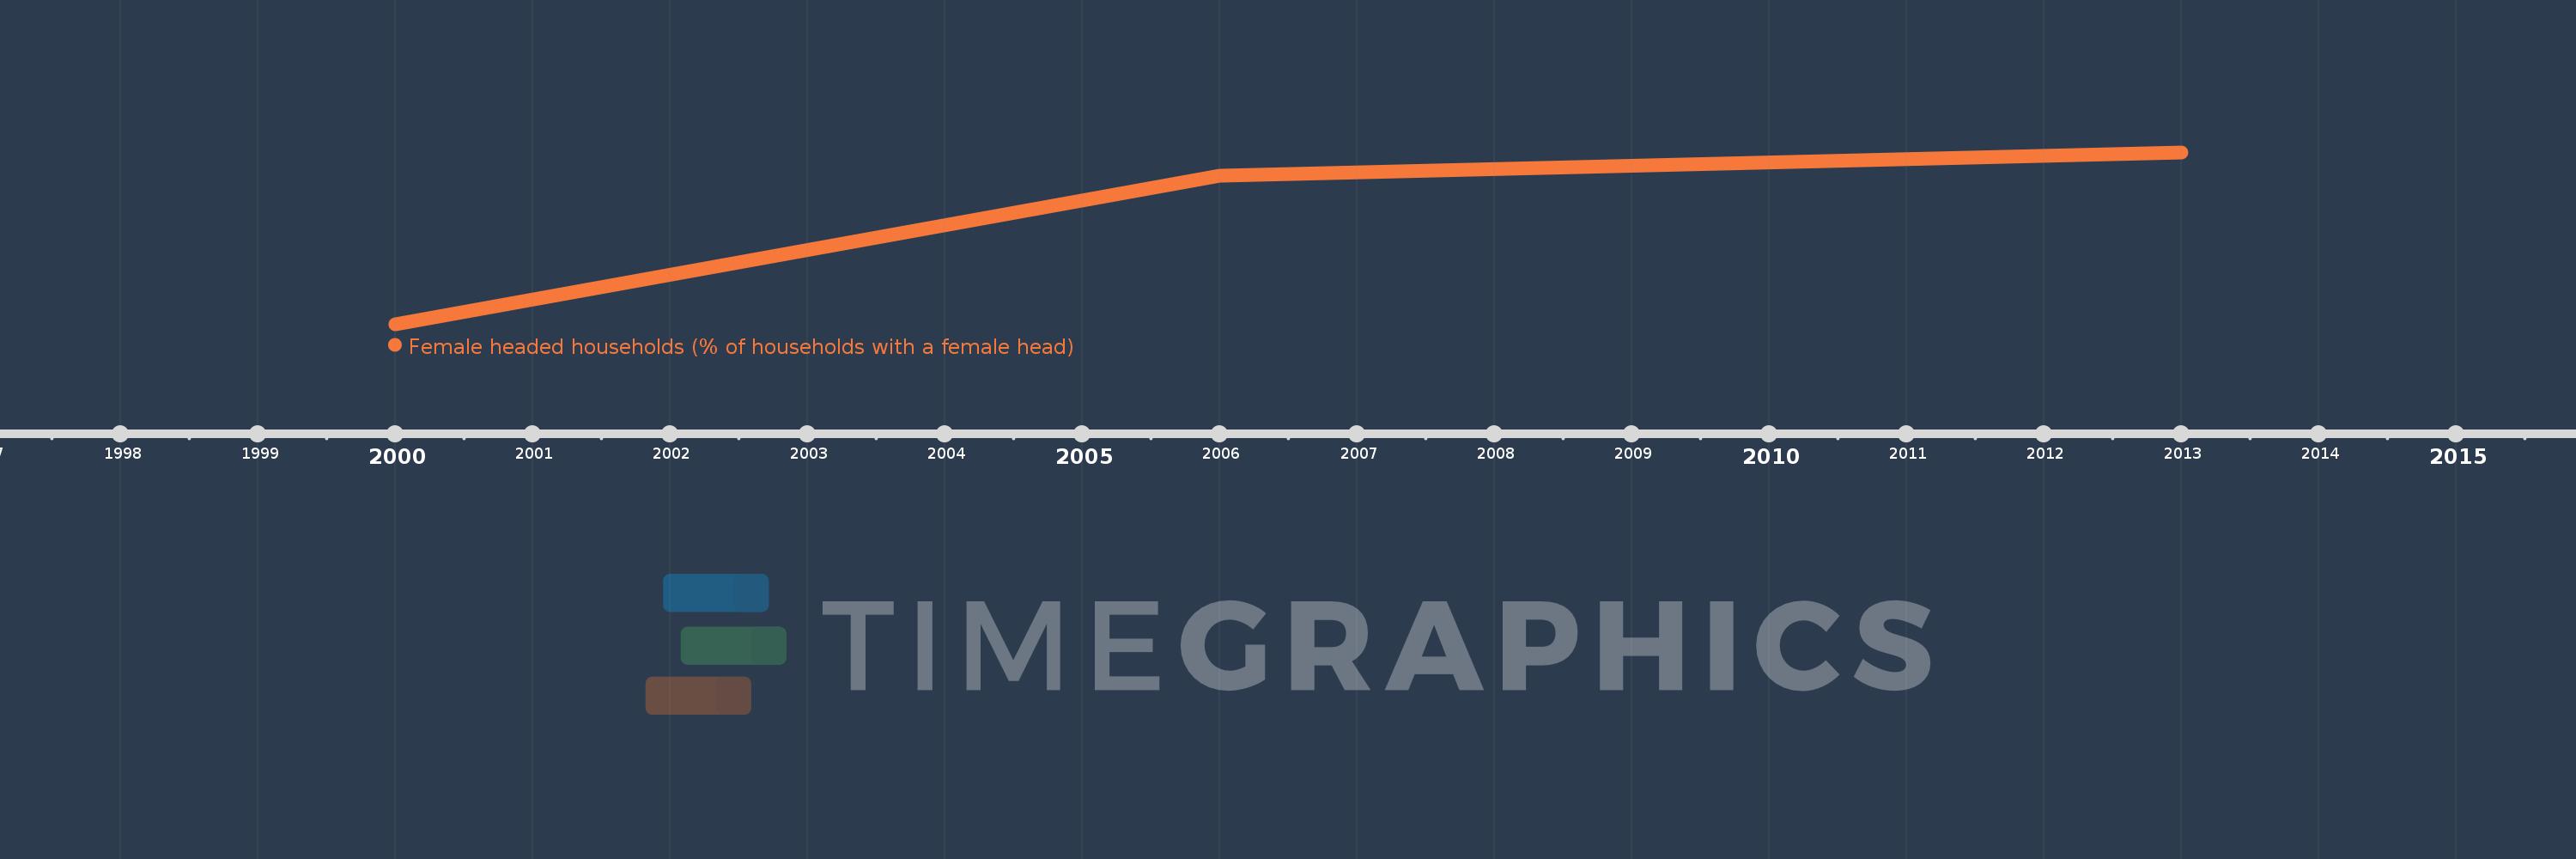
Female headed households (% of households with a female head)
2013,2006,2000
This statistics in other country:
Timeline:
This timeline shows a graph from 2000 to 2013 of Guinea. No data until 1999. Number of actual observations by date: 3.
Source name:
World Development Indicators
Source organization:
Demographic and Health Surveys.
Categories, topics:
Health, Gender
Last updated:
apr 23, 2017
Indicators value changes by year
At the date of observation
Value
Absolute change
Change from previous value
jan 1, 2000
12.8
+12.8
0.0%
jan 1, 2006
16.7
+3.9
30.47%
jan 1, 2013
17.3
+0.6
3.59%
Ranking of countries by current statistics by years


Comments: