This statistics in other country:
Timeline:
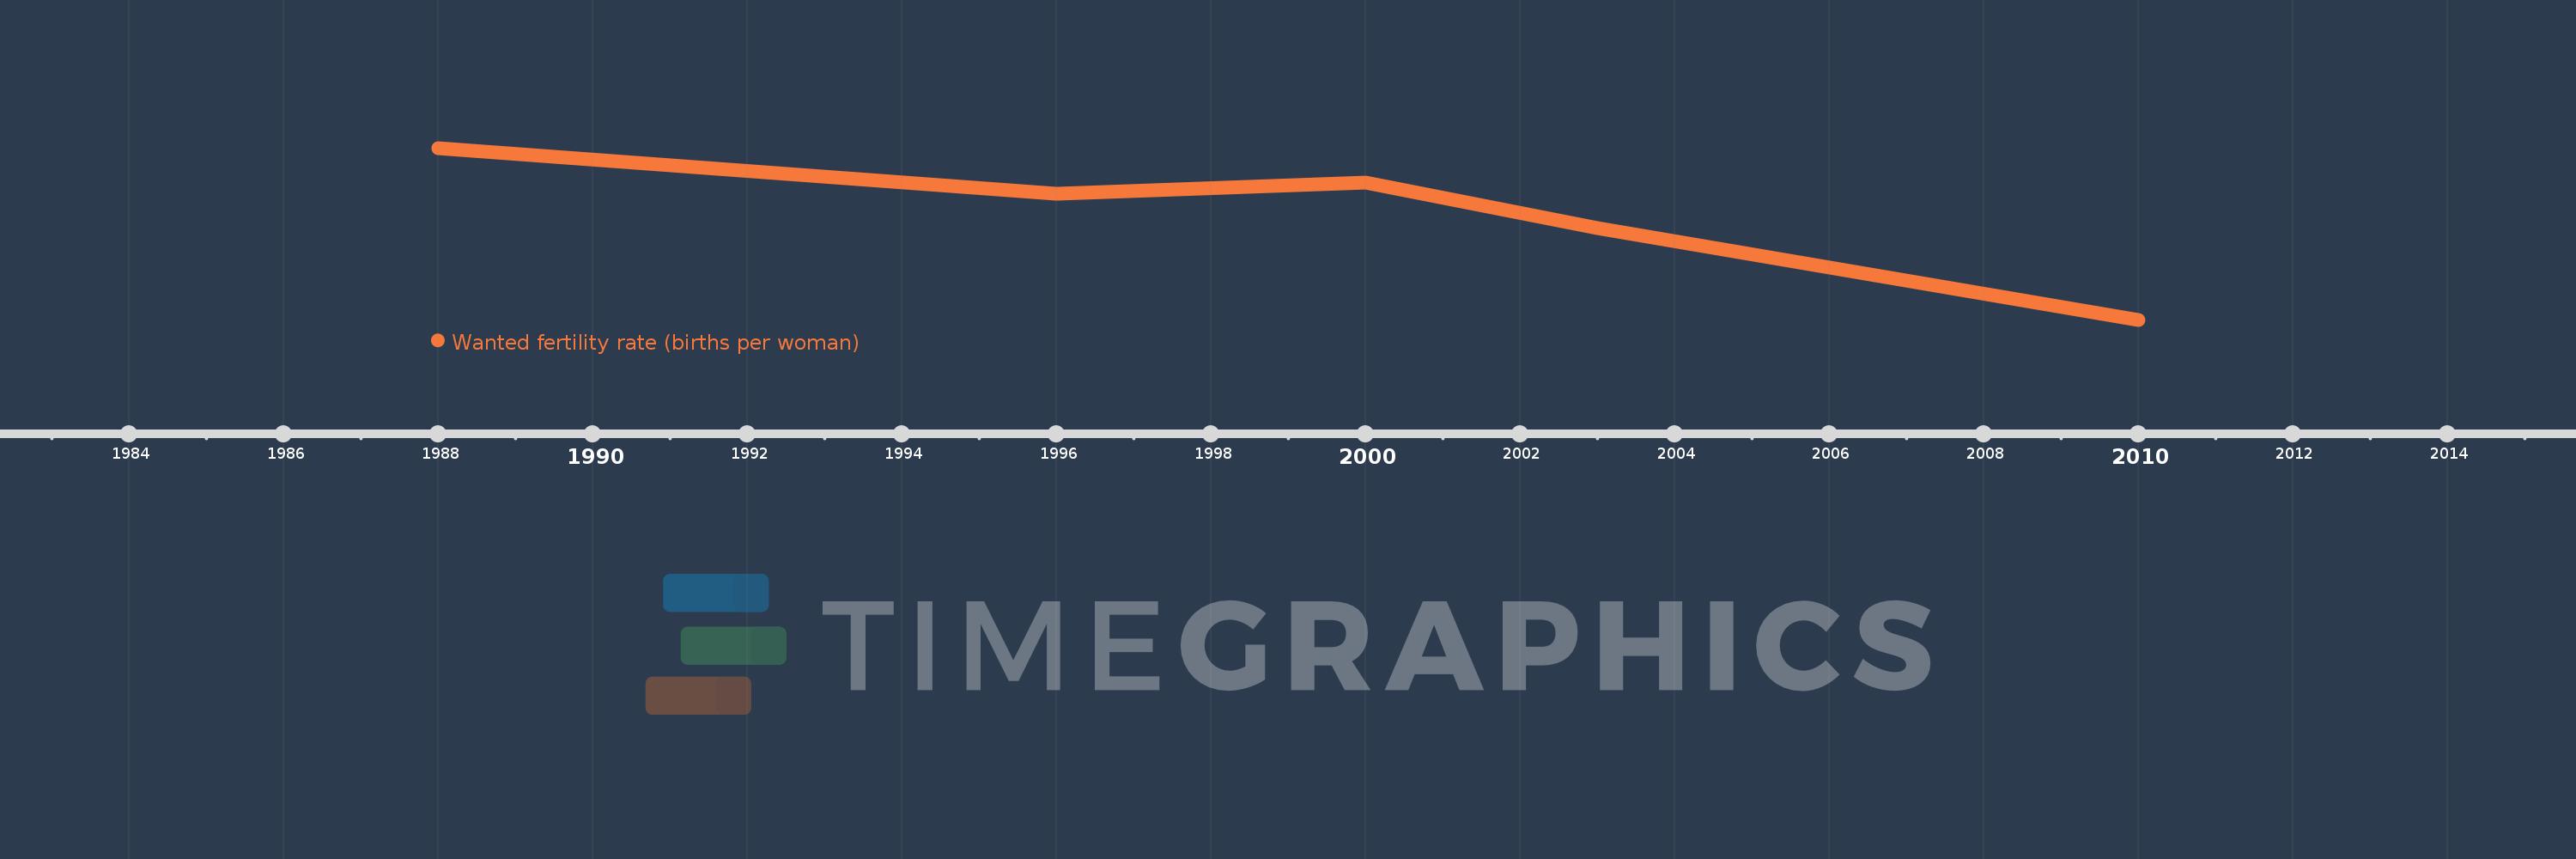
This timeline shows a graph from 1988 to 2010 of Guatemala. No data until 1987. Number of actual observations by date: 5.
Source name:
World Development Indicators
Source organization:
Demographic and Health Surveys.
Categories, topics:
Health, Gender
Last updated:
apr 23, 2017
Indicators value changes by year
At the date of observation
Value
Absolute change
Change from previous value
jan 1, 1996
4.0
-0.4
-9.09%
jan 1, 2003
3.7
-0.4
-9.76%
jan 1, 2010
2.9
-0.8
-21.62%
Ranking of countries by current statistics by years


Comments: