29
/
en
AIzaSyAYiBZKx7MnpbEhh9jyipgxe19OcubqV5w
April 1, 2024
143084
Grenada
GRD
true
2
1
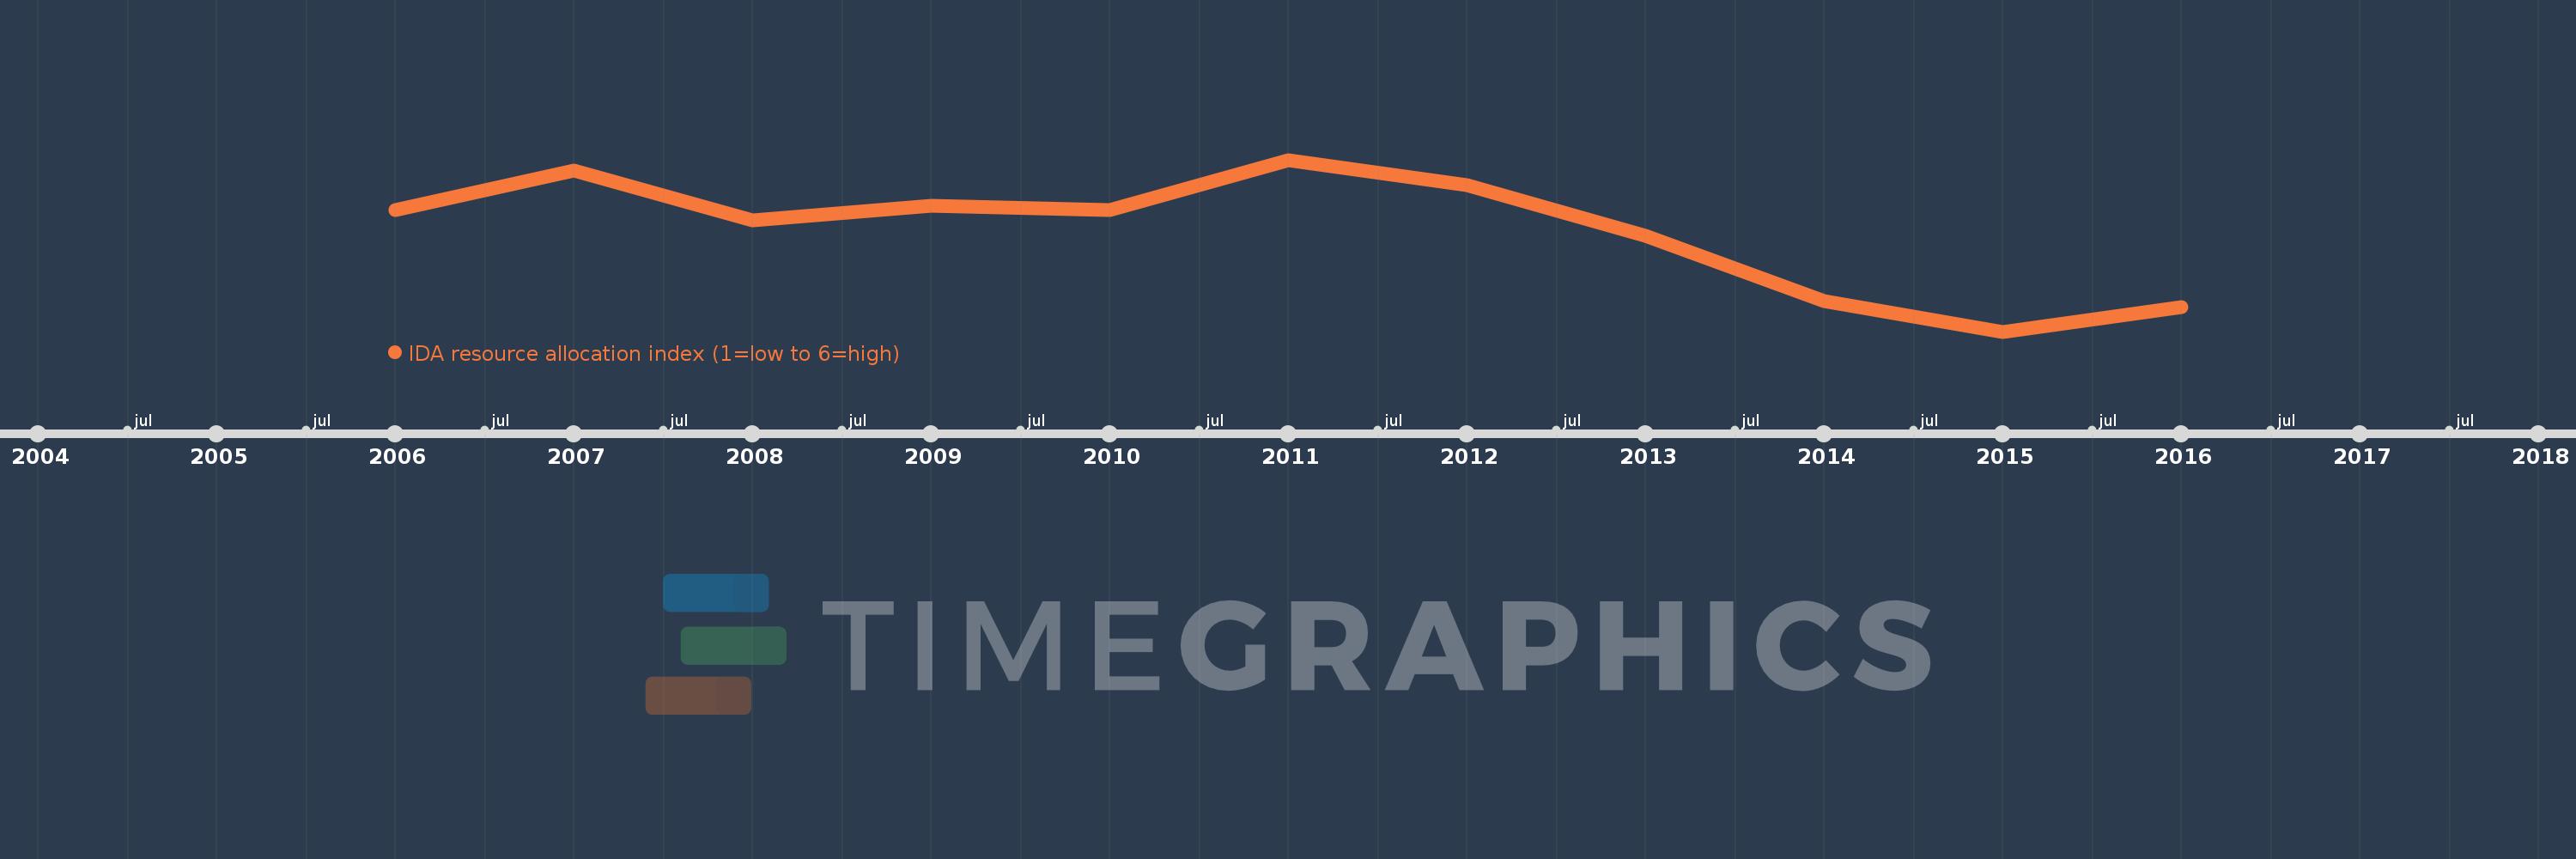
IDA resource allocation index (1=low to 6=high)
2016,2015,2014,2013,2012,2011,2010,2009,2008,2007,2006
This statistics in other country:
Timeline:
This timeline shows a graph from 2006 to 2016 of Grenada. No data until 2005. Number of actual observations by date: 11.
Source name:
World Development Indicators
Source organization:
World Bank Group, CPIA database (http://www.worldbank.org/ida).
Categories, topics:
Public Sector
Last updated:
apr 23, 2017
Indicators value changes by year
At the date of observation
Value
Absolute change
Change from previous value
jan 1, 2006
3.692
+3.692
0.0%
jan 1, 2007
3.758
+0.067
1.81%
jan 1, 2008
3.675
-0.083
-2.22%
jan 1, 2009
3.7
+0.025
0.68%
jan 1, 2010
3.692
-0.008
-0.23%
jan 1, 2011
3.775
+0.083
2.26%
jan 1, 2012
3.733
-0.042
-1.1%
jan 1, 2013
3.65
-0.083
-2.23%
jan 1, 2014
3.542
-0.108
-2.97%
jan 1, 2015
3.492
-0.05
-1.41%
jan 1, 2016
3.533
+0.042
1.19%
Ranking of countries by current statistics by years


Comments: