29
/
en
AIzaSyAYiBZKx7MnpbEhh9jyipgxe19OcubqV5w
April 1, 2024
141513
Greece
GRC
true
2
1
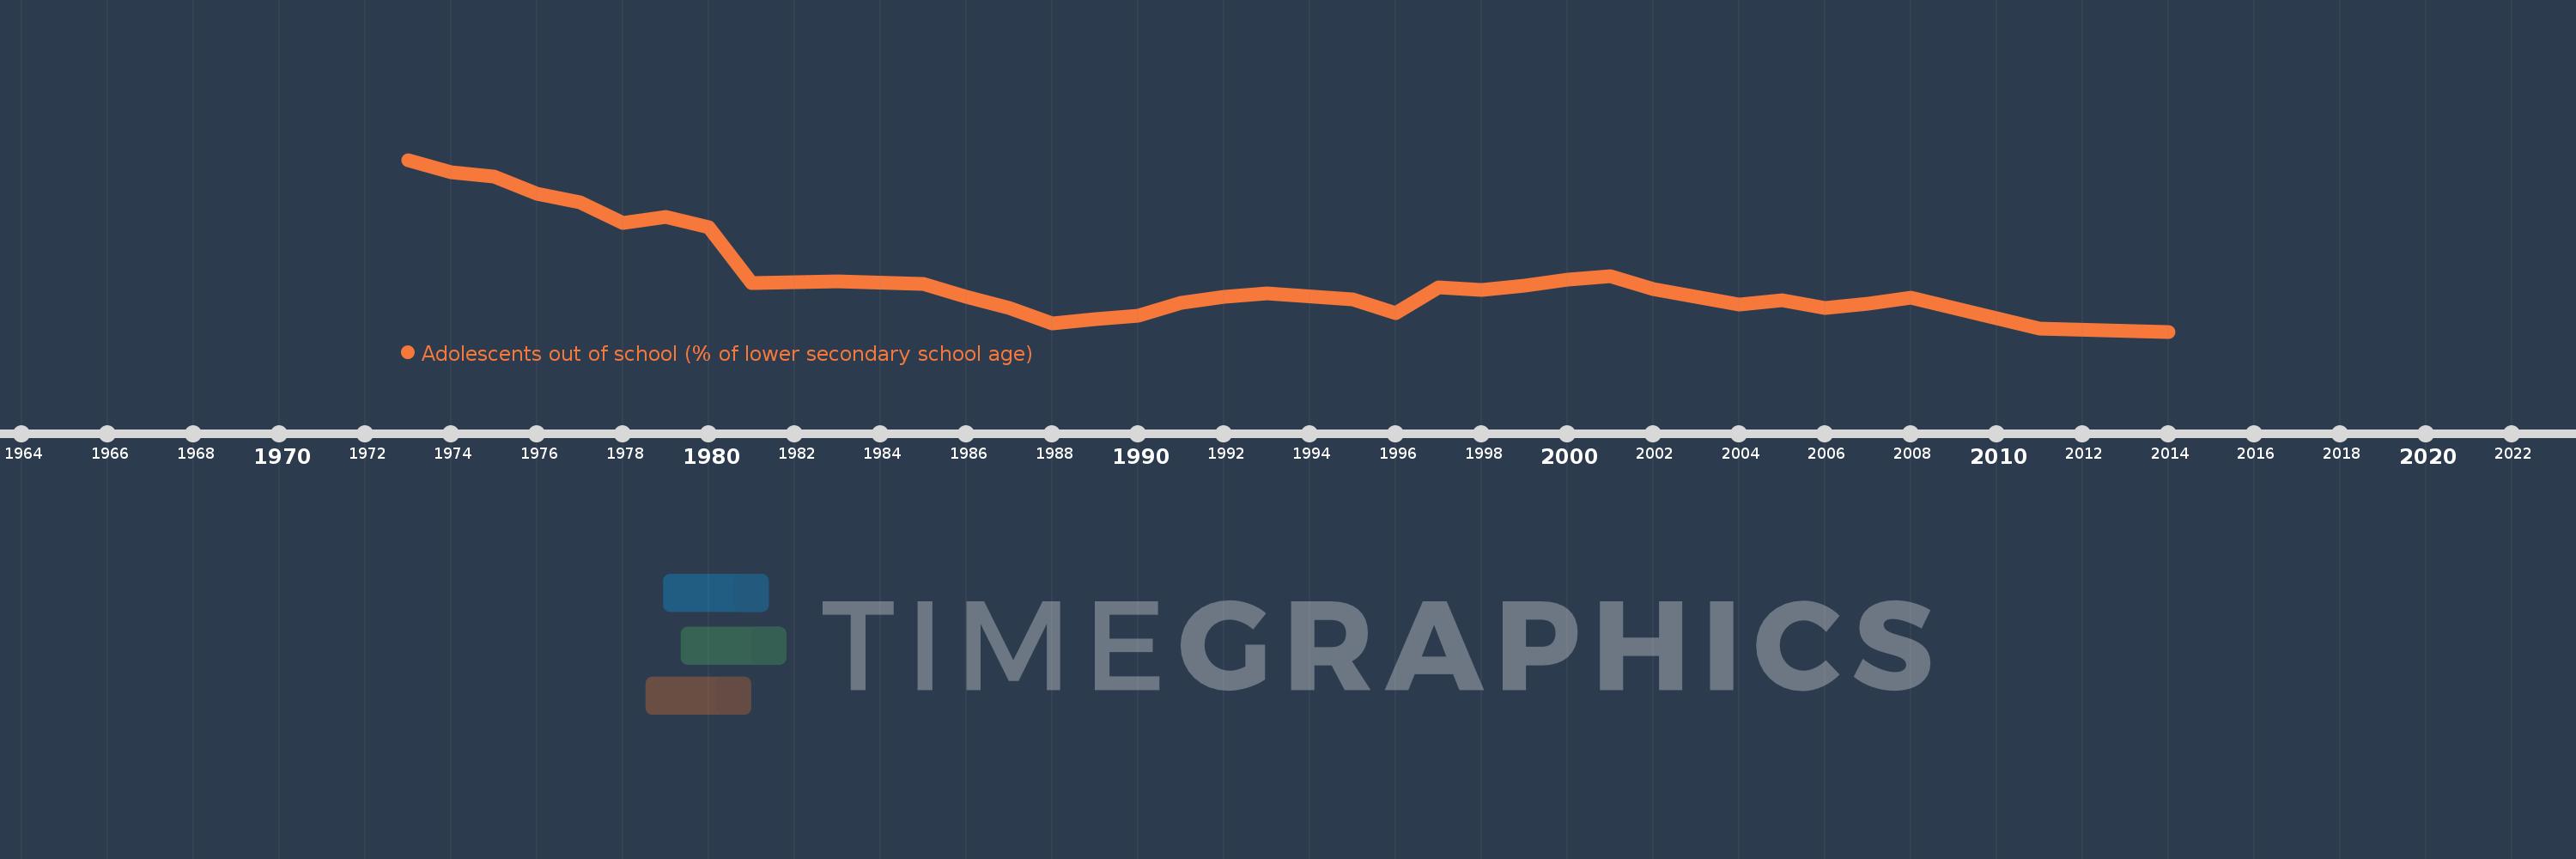
Adolescents out of school (% of lower secondary school age)
2014,2011,2008,2007,2006,2005,2004,2003,2002,2001,2000,1999,1998,1997,1996,1995,1993,1992,1991,1990,1989,1988,1987,1986,1985,1983,1981,1980,1979,1978,1977,1976,1975,1974,1973
This statistics in other country:
AfghanistanAlbaniaAlgeriaAngolaAntigua and BarbudaArab WorldArgentinaArmeniaArubaAustraliaAustriaAzerbaijanBahamas, TheBahrainBangladeshBarbadosBelarusBelgiumBelizeBeninBermudaBhutanBoliviaBotswanaBrazilBrunei DarussalamBulgariaBurkina FasoBurundiCabo VerdeCambodiaCameroonCanadaCaribbean small statesCentral African RepublicCentral Europe and the BalticsChadChileColombiaComorosCongo, Dem. Rep.Congo, Rep.Costa RicaCroatiaCubaCyprusDenmarkDjiboutiDominicaDominican RepublicEarly-demographic dividendEast Asia & PacificEast Asia & Pacific (excluding high income)East Asia & Pacific (IDA & IBRD countries)EcuadorEgypt, Arab Rep.El SalvadorEquatorial GuineaEritreaEstoniaEthiopiaEuro areaEurope & Central AsiaEurope & Central Asia (excluding high income)Europe & Central Asia (IDA & IBRD countries)European UnionFijiFinlandFragile and conflict affected situationsFranceGambia, TheGeorgiaGhanaGreeceGrenadaGuatemalaGuineaGuinea-BissauGuyanaHeavily indebted poor countries (HIPC)High incomeHondurasHong Kong SAR, ChinaHungaryIBRD onlyIcelandIDA & IBRD totalIDA blendIDA onlyIDA totalIndiaIndonesiaIran, Islamic Rep.IraqIrelandIsraelItalyJamaicaJapanJordanKazakhstanKenyaKiribatiKorea, Dem. People’s Rep.Korea, Rep.KuwaitKyrgyz RepublicLao PDRLate-demographic dividendLatin America & Caribbean Latin America & Caribbean (excluding high income)Latin America & the Caribbean (IDA & IBRD countries)LatviaLeast developed countries: UN classificationLebanonLesothoLibyaLiechtensteinLithuaniaLow & middle incomeLow incomeLower middle incomeLuxembourgMacao SAR, ChinaMacedonia, FYRMadagascarMalawiMalaysiaMaldivesMaliMaltaMarshall IslandsMauritaniaMauritiusMexicoMiddle East & North AfricaMiddle East & North Africa (excluding high income)Middle East & North Africa (IDA & IBRD countries)Middle incomeMoldovaMongoliaMoroccoMozambiqueMyanmarNamibiaNauruNetherlandsNew ZealandNicaraguaNigerNorth AmericaNorwayOECD membersOmanOther small statesPacific island small statesPakistanPanamaParaguayPeruPhilippinesPolandPortugalPost-demographic dividendPre-demographic dividendPuerto RicoQatarRomaniaRussian FederationSamoaSao Tome and PrincipeSaudi ArabiaSenegalSerbiaSeychellesSierra LeoneSloveniaSmall statesSolomon IslandsSomaliaSouth AfricaSouth AsiaSouth Asia (IDA & IBRD)SpainSri LankaSt. Kitts and NevisSt. LuciaSt. Vincent and the GrenadinesSub-Saharan Africa Sub-Saharan Africa (excluding high income)Sub-Saharan Africa (IDA & IBRD countries)SudanSurinameSwazilandSwedenSwitzerlandSyrian Arab RepublicTajikistanThailandTimor-LesteTogoTongaTrinidad and TobagoTunisiaTurkeyTuvaluUgandaUkraineUnited Arab EmiratesUnited KingdomUnited StatesUpper middle incomeUruguayUzbekistanVanuatuVenezuela, RBVietnamWest Bank and GazaWorldYemen, Rep.Zimbabwe Timeline:
This timeline shows a graph from 1973 to 2014 of Greece. No data until 1972. Number of actual observations by date: 35.
Source name:
World Development Indicators
Source organization:
United Nations Educational, Scientific, and Cultural Organization (UNESCO) Institute for Statistics.
Categories, topics:
Education
Last updated:
apr 23, 2017
Indicators value changes by year
At the date of observation
Value
Absolute change
Change from previous value
jan 1, 1973
29.68
+29.68
0.0%
jan 1, 1974
27.664
-2.015
-6.79%
jan 1, 1975
26.807
-0.857
-3.1%
jan 1, 1976
23.969
-2.839
-10.59%
jan 1, 1977
22.581
-1.387
-5.79%
jan 1, 1978
19.034
-3.547
-15.71%
jan 1, 1979
20.077
+1.044
5.48%
jan 1, 1980
18.316
-1.761
-8.77%
jan 1, 1981
9.035
-9.282
-50.67%
jan 1, 1983
9.287
+0.252
2.79%
jan 1, 1985
8.829
-0.457
-4.93%
jan 1, 1986
6.788
-2.041
-23.11%
jan 1, 1987
4.894
-1.895
-27.91%
jan 1, 1988
2.269
-2.625
-53.64%
jan 1, 1989
2.974
+0.706
31.1%
jan 1, 1990
3.534
+0.56
18.83%
jan 1, 1991
5.7
+2.167
61.31%
jan 1, 1992
6.729
+1.029
18.05%
jan 1, 1993
7.375
+0.646
9.6%
jan 1, 1995
6.306
-1.069
-14.5%
jan 1, 1996
4.052
-2.254
-35.75%
jan 1, 1997
8.334
+4.282
105.68%
jan 1, 1998
7.835
-0.499
-5.99%
jan 1, 1999
8.653
+0.819
10.45%
jan 1, 2000
9.54
+0.886
10.24%
jan 1, 2001
10.175
+0.635
6.66%
jan 1, 2002
7.961
-2.214
-21.76%
jan 1, 2003
6.766
-1.195
-15.02%
jan 1, 2004
5.481
-1.285
-18.99%
jan 1, 2005
6.135
+0.654
11.93%
jan 1, 2006
4.827
-1.307
-21.31%
jan 1, 2007
5.553
+0.726
15.03%
jan 1, 2008
6.593
+1.04
18.72%
jan 1, 2011
1.378
-5.215
-79.09%
jan 1, 2014
0.9
-0.478
-34.69%
Ranking of countries by current statistics by years


Comments: