29
/
en
AIzaSyAYiBZKx7MnpbEhh9jyipgxe19OcubqV5w
April 1, 2024
141280
Ghana
GHA
true
2
1
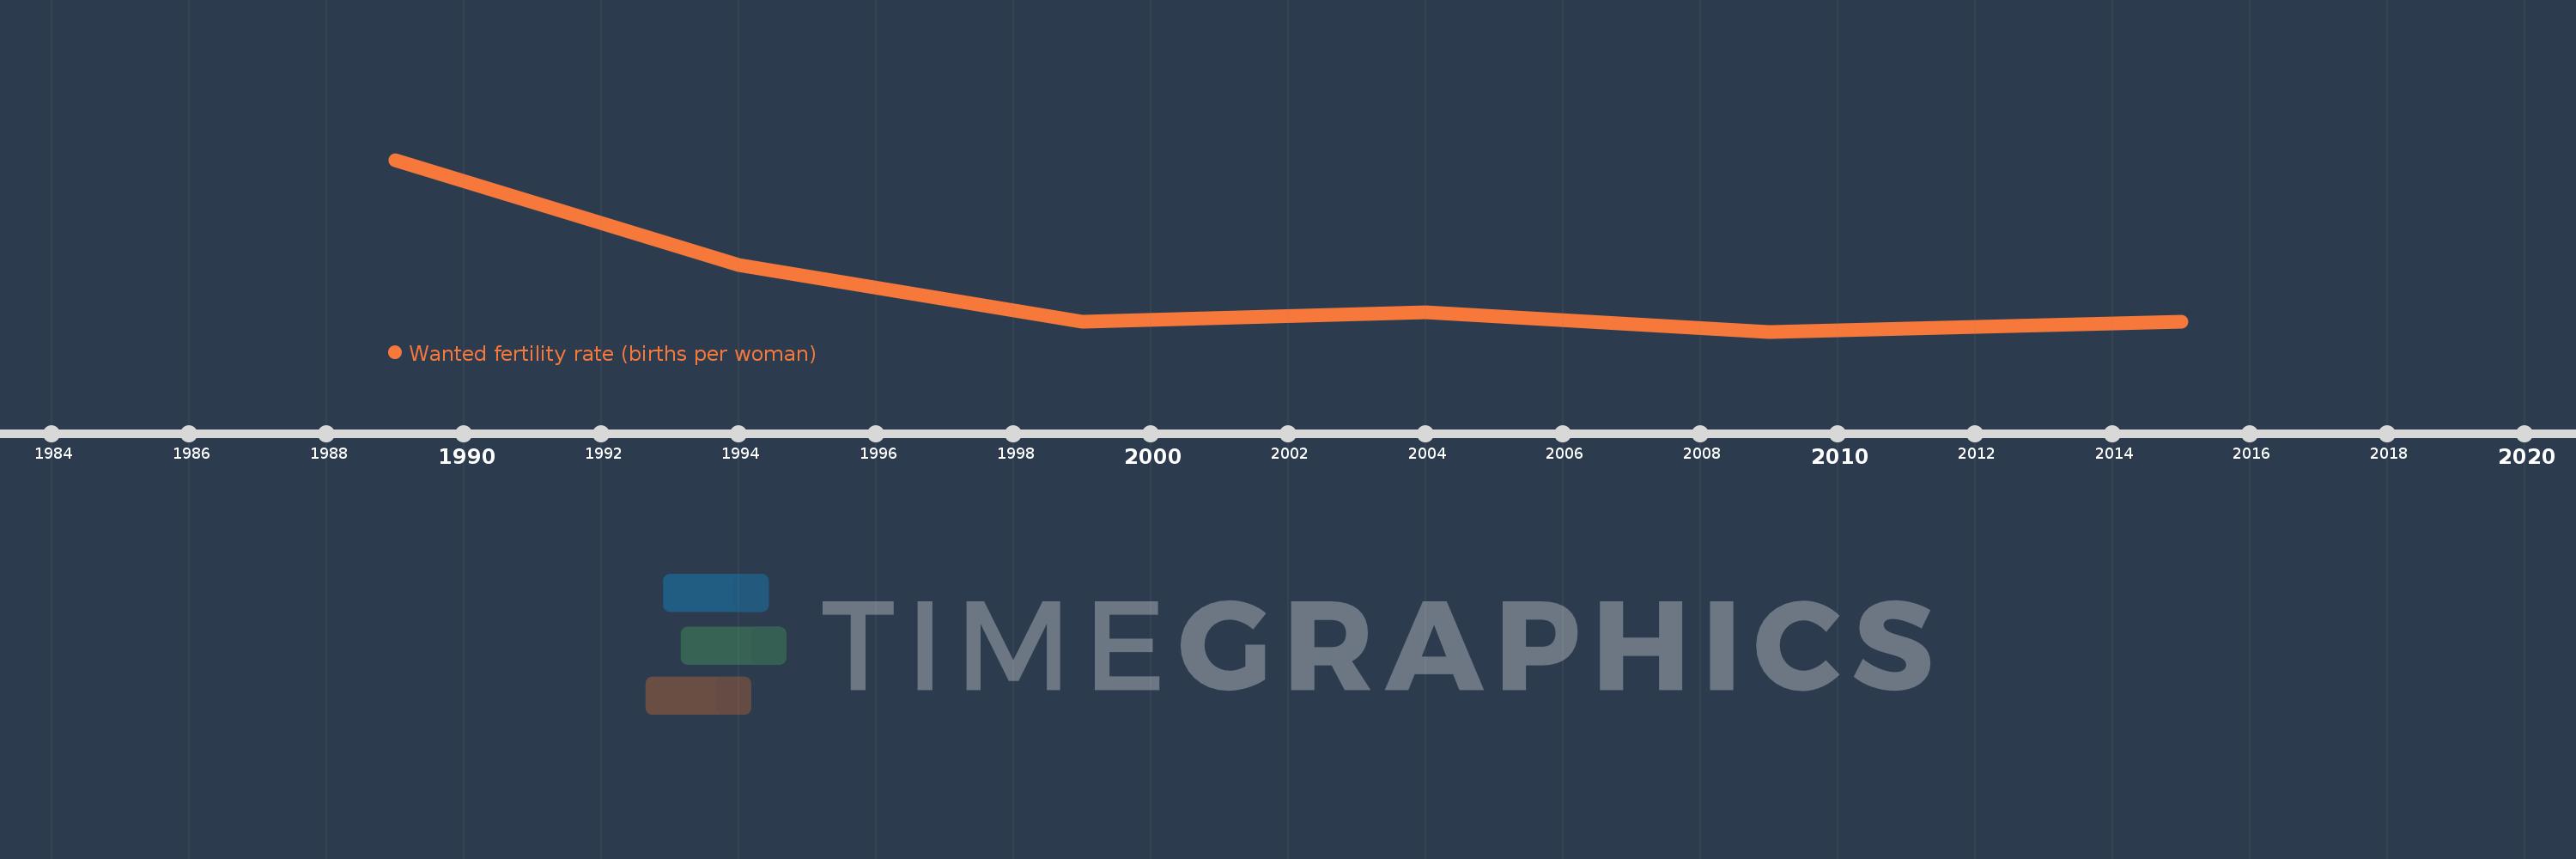
Wanted fertility rate (births per woman)
2015,2009,2004,1999,1994,1989
This statistics in other country:
Timeline:
This timeline shows a graph from 1989 to 2015 of Ghana. No data until 1988. Number of actual observations by date: 6.
Source name:
World Development Indicators
Source organization:
Demographic and Health Surveys.
Categories, topics:
Health, Gender
Last updated:
apr 23, 2017
Indicators value changes by year
At the date of observation
Value
Absolute change
Change from previous value
jan 1, 1994
4.2
-1.1
-20.75%
jan 1, 1999
3.6
-0.6
-14.29%
jan 1, 2004
3.7
+0.1
2.78%
jan 1, 2009
3.5
-0.2
-5.41%
jan 1, 2015
3.6
+0.1
2.86%
Ranking of countries by current statistics by years


Comments: