29
/
en
AIzaSyAYiBZKx7MnpbEhh9jyipgxe19OcubqV5w
April 1, 2024
139662
Germany
DEU
true
2
1
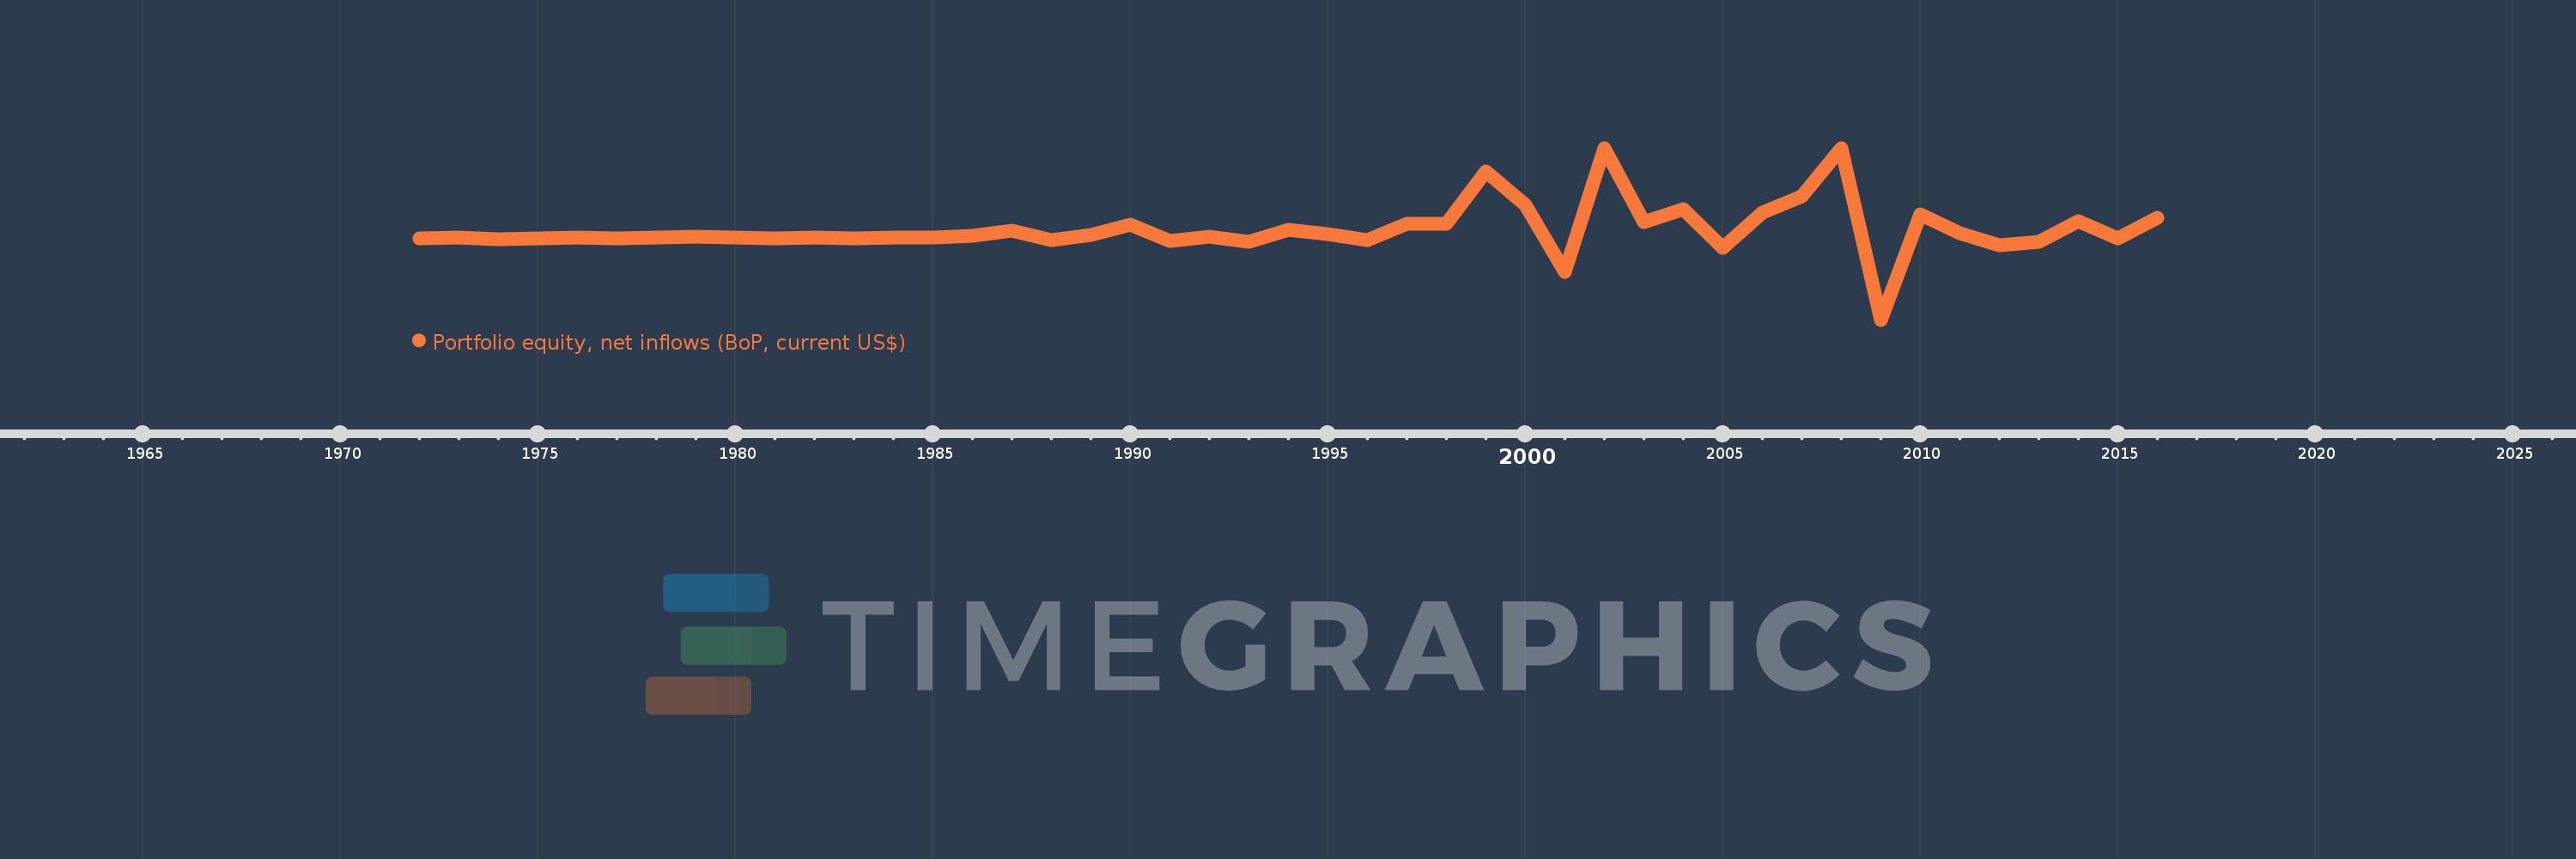
Portfolio equity, net inflows (BoP, current US$)
2016,2015,2014,2013,2012,2011,2010,2009,2008,2007,2006,2005,2004,2003,2002,2001,2000,1999,1998,1997,1996,1995,1994,1993,1992,1991,1990,1989,1988,1987,1986,1985,1984,1983,1982,1981,1980,1979,1978,1977,1976,1975,1974,1973,1972
This statistics in other country:
AfghanistanAlbaniaAlgeriaAngolaAntigua and BarbudaArab WorldArgentinaArmeniaArubaAustraliaAustriaAzerbaijanBahamas, TheBahrainBangladeshBarbadosBelarusBelgiumBelizeBeninBermudaBhutanBoliviaBosnia and HerzegovinaBotswanaBrazilBulgariaBurkina FasoBurundiCabo VerdeCambodiaCameroonCanadaCaribbean small statesCentral African RepublicCentral Europe and the BalticsChadChileChinaColombiaComorosCongo, Dem. Rep.Congo, Rep.Costa RicaCote d'IvoireCroatiaCuracaoCyprusCzech RepublicDenmarkDjiboutiDominicaDominican RepublicEarly-demographic dividendEast Asia & PacificEast Asia & Pacific (excluding high income)East Asia & Pacific (IDA & IBRD countries)EcuadorEgypt, Arab Rep.El SalvadorEquatorial GuineaEstoniaEthiopiaEuro areaEurope & Central AsiaEurope & Central Asia (excluding high income)Europe & Central Asia (IDA & IBRD countries)European UnionFijiFinlandFragile and conflict affected situationsFranceFrench PolynesiaGabonGambia, TheGeorgiaGermanyGhanaGreeceGrenadaGuatemalaGuineaGuinea-BissauGuyanaHaitiHeavily indebted poor countries (HIPC)High incomeHondurasHong Kong SAR, ChinaHungaryIBRD onlyIcelandIDA & IBRD totalIDA blendIDA onlyIDA totalIndiaIndonesiaIran, Islamic Rep.IraqIrelandIsraelItalyJamaicaJapanJordanKazakhstanKenyaKiribatiKorea, Rep.KosovoKuwaitKyrgyz RepublicLao PDRLate-demographic dividendLatin America & Caribbean Latin America & Caribbean (excluding high income)Latin America & the Caribbean (IDA & IBRD countries)LatviaLeast developed countries: UN classificationLebanonLesothoLiberiaLibyaLithuaniaLow & middle incomeLow incomeLower middle incomeLuxembourgMacao SAR, ChinaMacedonia, FYRMadagascarMalawiMalaysiaMaldivesMaliMaltaMarshall IslandsMauritaniaMauritiusMexicoMiddle East & North AfricaMiddle East & North Africa (excluding high income)Middle East & North Africa (IDA & IBRD countries)Middle incomeMoldovaMongoliaMontenegroMoroccoMozambiqueMyanmarNamibiaNepalNetherlandsNew CaledoniaNew ZealandNicaraguaNigerNigeriaNorth AmericaNorwayOECD membersOmanOther small statesPacific island small statesPakistanPanamaPapua New GuineaParaguayPeruPhilippinesPolandPortugalPost-demographic dividendPre-demographic dividendQatarRomaniaRussian FederationRwandaSamoaSao Tome and PrincipeSaudi ArabiaSenegalSerbiaSeychellesSierra LeoneSingaporeSlovak RepublicSloveniaSmall statesSolomon IslandsSomaliaSouth AfricaSouth AsiaSouth Asia (IDA & IBRD)SpainSri LankaSt. Kitts and NevisSt. LuciaSt. Vincent and the GrenadinesSub-Saharan Africa Sub-Saharan Africa (excluding high income)Sub-Saharan Africa (IDA & IBRD countries)SudanSurinameSwazilandSwedenSwitzerlandSyrian Arab RepublicTajikistanTanzaniaThailandTimor-LesteTogoTongaTrinidad and TobagoTunisiaTurkeyUgandaUkraineUnited KingdomUnited StatesUpper middle incomeUruguayVanuatuVenezuela, RBVietnamWest Bank and GazaWorldYemen, Rep.ZambiaZimbabwe Timeline:
This timeline shows a graph from 1972 to 2016 of Germany. No data until 1971. Number of actual observations by date: 45.
Source name:
World Development Indicators
Source organization:
International Monetary Fund, Balance of Payments database, and World Bank, International Debt Statistics.
Categories, topics:
Economy & Growth, Financial Sector, External Debt
Last updated:
apr 23, 2017
Indicators value changes by year
Minimum:
-68.644 bln
jan 1, 2009
Maximum:
76.962 bln
jan 1, 2008
At the date of observation
Value
Absolute change
Change from previous value
jan 1, 1972
107.531 mln
+107.531 mln
0.0%
jan 1, 1973
935.099 mln
+827.568 mln
769.61%
jan 1, 1974
-89.418 mln
-1.025 bln
-109.56%
jan 1, 1975
13.122 mln
+102.541 mln
-114.68%
jan 1, 1976
774.671 mln
+761.548 mln
5.8K%
jan 1, 1977
650.261 mln
-124.41 mln
-16.06%
jan 1, 1978
697.141 mln
+46.88 mln
7.21%
jan 1, 1979
1.519 bln
+821.839 mln
117.89%
jan 1, 1980
1.006 bln
-513.397 mln
-33.8%
jan 1, 1981
313.152 mln
-692.43 mln
-68.86%
jan 1, 1982
1.073 bln
+759.675 mln
242.59%
jan 1, 1983
204.904 mln
-867.924 mln
-80.9%
jan 1, 1984
1.105 bln
+900.547 mln
439.5%
jan 1, 1985
1.292 bln
+186.429 mln
16.86%
jan 1, 1986
2.154 bln
+862.006 mln
66.72%
jan 1, 1987
6.829 bln
+4.675 bln
217.06%
jan 1, 1988
-836.127 mln
-7.665 bln
-112.24%
jan 1, 1989
3.018 bln
+3.854 bln
-460.92%
jan 1, 1990
12.084 bln
+9.066 bln
300.42%
jan 1, 1991
-1.899 bln
-13.983 bln
-115.72%
jan 1, 1992
1.638 bln
+3.537 bln
-186.23%
jan 1, 1993
-2.806 bln
-4.444 bln
-271.29%
jan 1, 1994
7.541 bln
+10.347 bln
-368.77%
jan 1, 1995
3.924 bln
-3.617 bln
-47.97%
jan 1, 1996
-1.513 bln
-5.436 bln
-138.56%
jan 1, 1997
12.981 bln
+14.494 bln
-958.1%
jan 1, 1998
12.869 bln
-112.105 mln
-0.86%
jan 1, 1999
56.769 bln
+43.9 bln
341.13%
jan 1, 2000
28.706 bln
-28.064 bln
-49.43%
jan 1, 2001
-27.96 bln
-56.666 bln
-197.4%
jan 1, 2002
76.894 bln
+104.854 bln
-375.01%
jan 1, 2003
13.816 bln
-63.077 bln
-82.03%
jan 1, 2004
25.234 bln
+11.417 bln
82.64%
jan 1, 2005
-7.882 bln
-33.116 bln
-131.24%
jan 1, 2006
22.063 bln
+29.945 bln
-379.9%
jan 1, 2007
35.659 bln
+13.596 bln
61.63%
jan 1, 2008
76.962 bln
+41.303 bln
115.83%
jan 1, 2009
-68.644 bln
-145.605 bln
-189.19%
jan 1, 2010
20.834 bln
+89.478 bln
-130.35%
jan 1, 2011
4.763 bln
-16.072 bln
-77.14%
jan 1, 2012
-5.488 bln
-10.251 bln
-215.24%
jan 1, 2013
-2.525 bln
+2.964 bln
-54.0%
jan 1, 2014
14.926 bln
+17.451 bln
-691.25%
jan 1, 2015
395.915 mln
-14.53 bln
-97.35%
jan 1, 2016
17.498 bln
+17.102 bln
4.32K%
Ranking of countries by current statistics by years


Comments: