29
/
en
AIzaSyAYiBZKx7MnpbEhh9jyipgxe19OcubqV5w
April 1, 2024
138594
Georgia
GEO
true
2
1
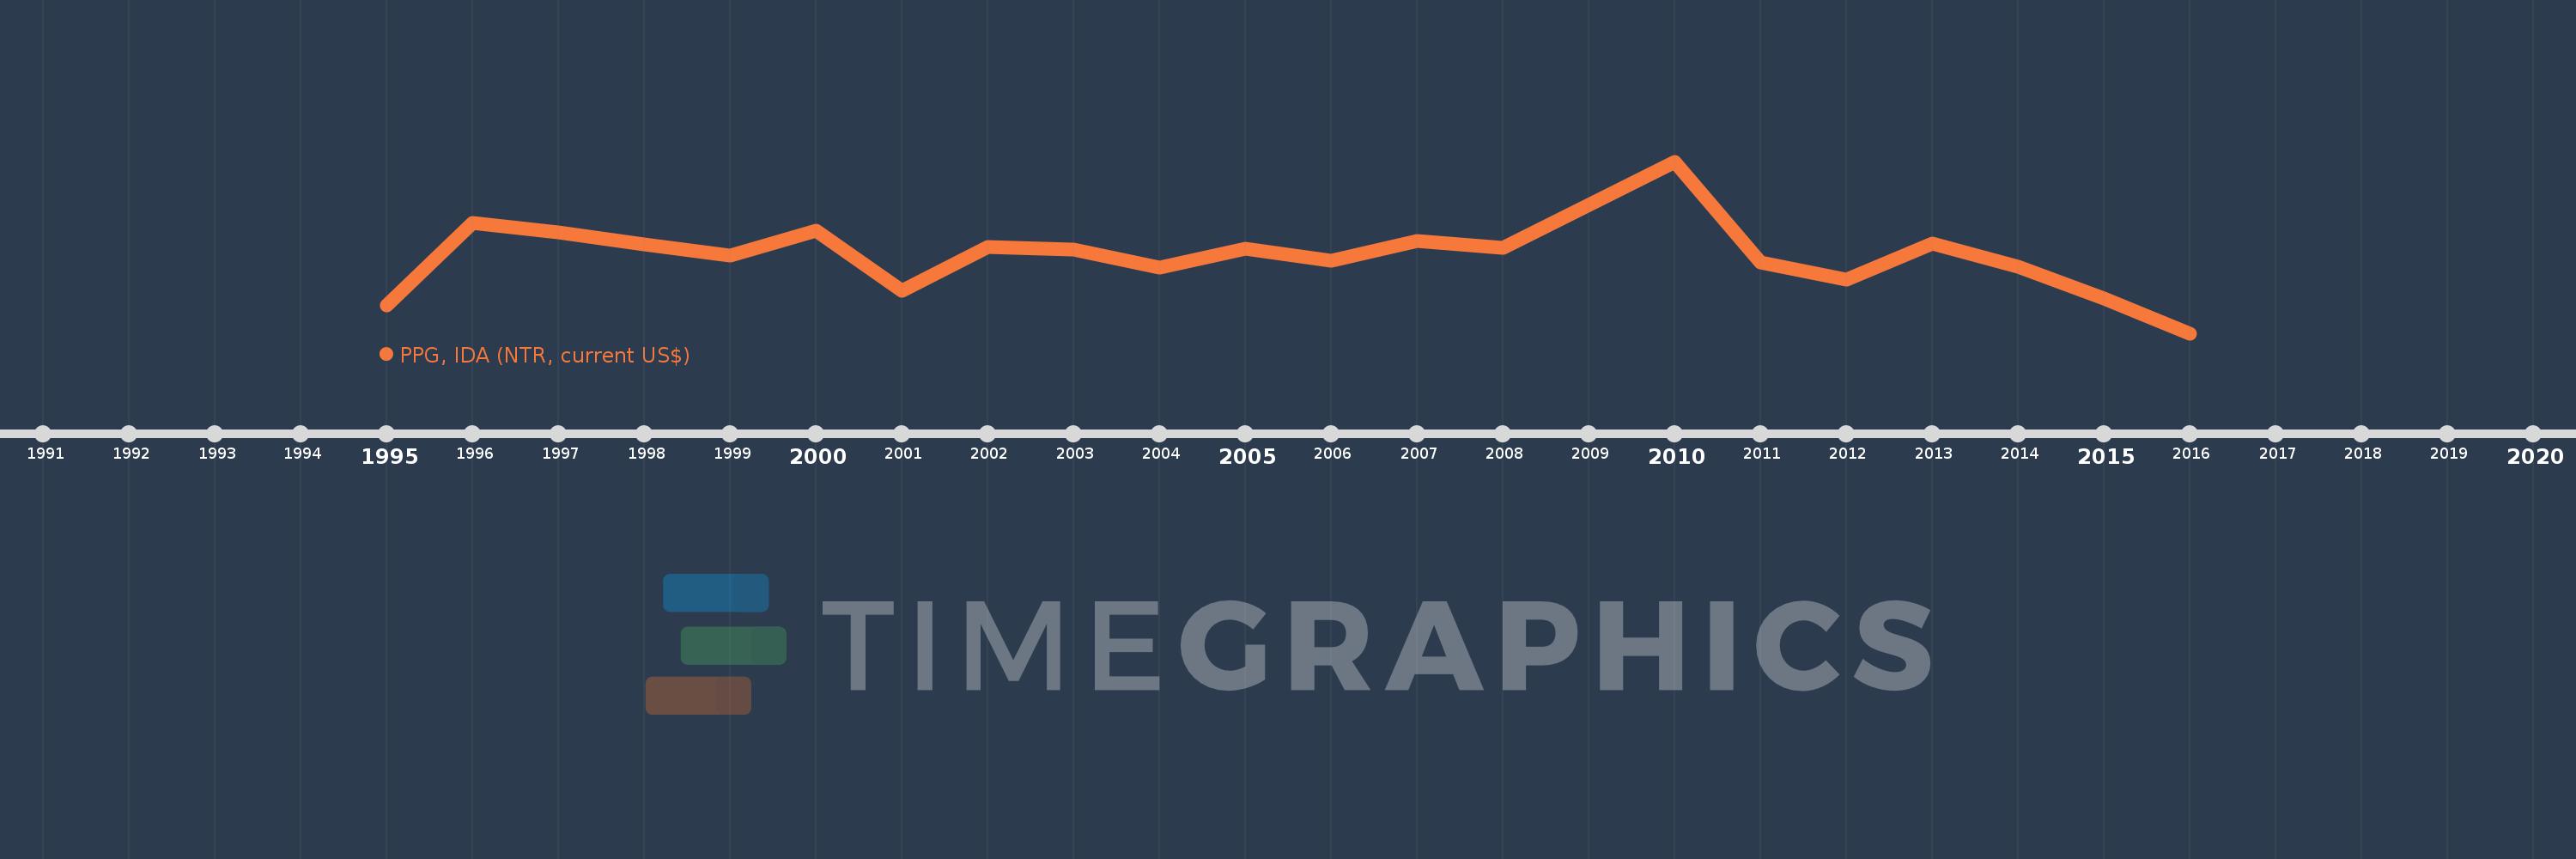
PPG, IDA (NTR, current US$)
2016,2015,2014,2013,2012,2011,2010,2009,2008,2007,2006,2005,2004,2003,2002,2001,2000,1999,1998,1997,1996,1995
This statistics in other country:
Timeline:
This timeline shows a graph from 1995 to 2016 of Georgia. No data until 1994. Number of actual observations by date: 22.
Source name:
World Development Indicators
Source organization:
World Bank, International Debt Statistics.
Categories, topics:
External Debt
Last updated:
apr 23, 2017
Indicators value changes by year
Minimum:
-27.814 mln
jan 1, 2016
Maximum:
147.975 mln
jan 1, 2010
At the date of observation
Value
Absolute change
Change from previous value
jan 1, 1995
971.0K
+971.0K
0.0%
jan 1, 1996
84.998 mln
+84.027 mln
8.65K%
jan 1, 1997
75.688 mln
-9.31 mln
-10.95%
jan 1, 1998
63.121 mln
-12.567 mln
-16.6%
jan 1, 1999
51.356 mln
-11.765 mln
-18.64%
jan 1, 2000
76.905 mln
+25.549 mln
49.75%
jan 1, 2001
15.315 mln
-61.59 mln
-80.09%
jan 1, 2002
60.544 mln
+45.229 mln
295.32%
jan 1, 2003
58.228 mln
-2.316 mln
-3.83%
jan 1, 2004
39.548 mln
-18.68 mln
-32.08%
jan 1, 2005
58.958 mln
+19.41 mln
49.08%
jan 1, 2006
46.506 mln
-12.452 mln
-21.12%
jan 1, 2007
66.632 mln
+20.126 mln
43.28%
jan 1, 2008
59.204 mln
-7.428 mln
-11.15%
jan 1, 2009
103.235 mln
+44.031 mln
74.37%
jan 1, 2010
147.975 mln
+44.74 mln
43.34%
jan 1, 2011
44.457 mln
-103.518 mln
-69.96%
jan 1, 2012
27.331 mln
-17.126 mln
-38.52%
jan 1, 2013
64.066 mln
+36.735 mln
134.41%
jan 1, 2014
40.409 mln
-23.657 mln
-36.93%
jan 1, 2015
7.812 mln
-32.597 mln
-80.67%
jan 1, 2016
-27.814 mln
-35.626 mln
-456.04%
Ranking of countries by current statistics by years


Comments: