29
/
en
AIzaSyAYiBZKx7MnpbEhh9jyipgxe19OcubqV5w
April 1, 2024
138591
Georgia
GEO
true
2
1
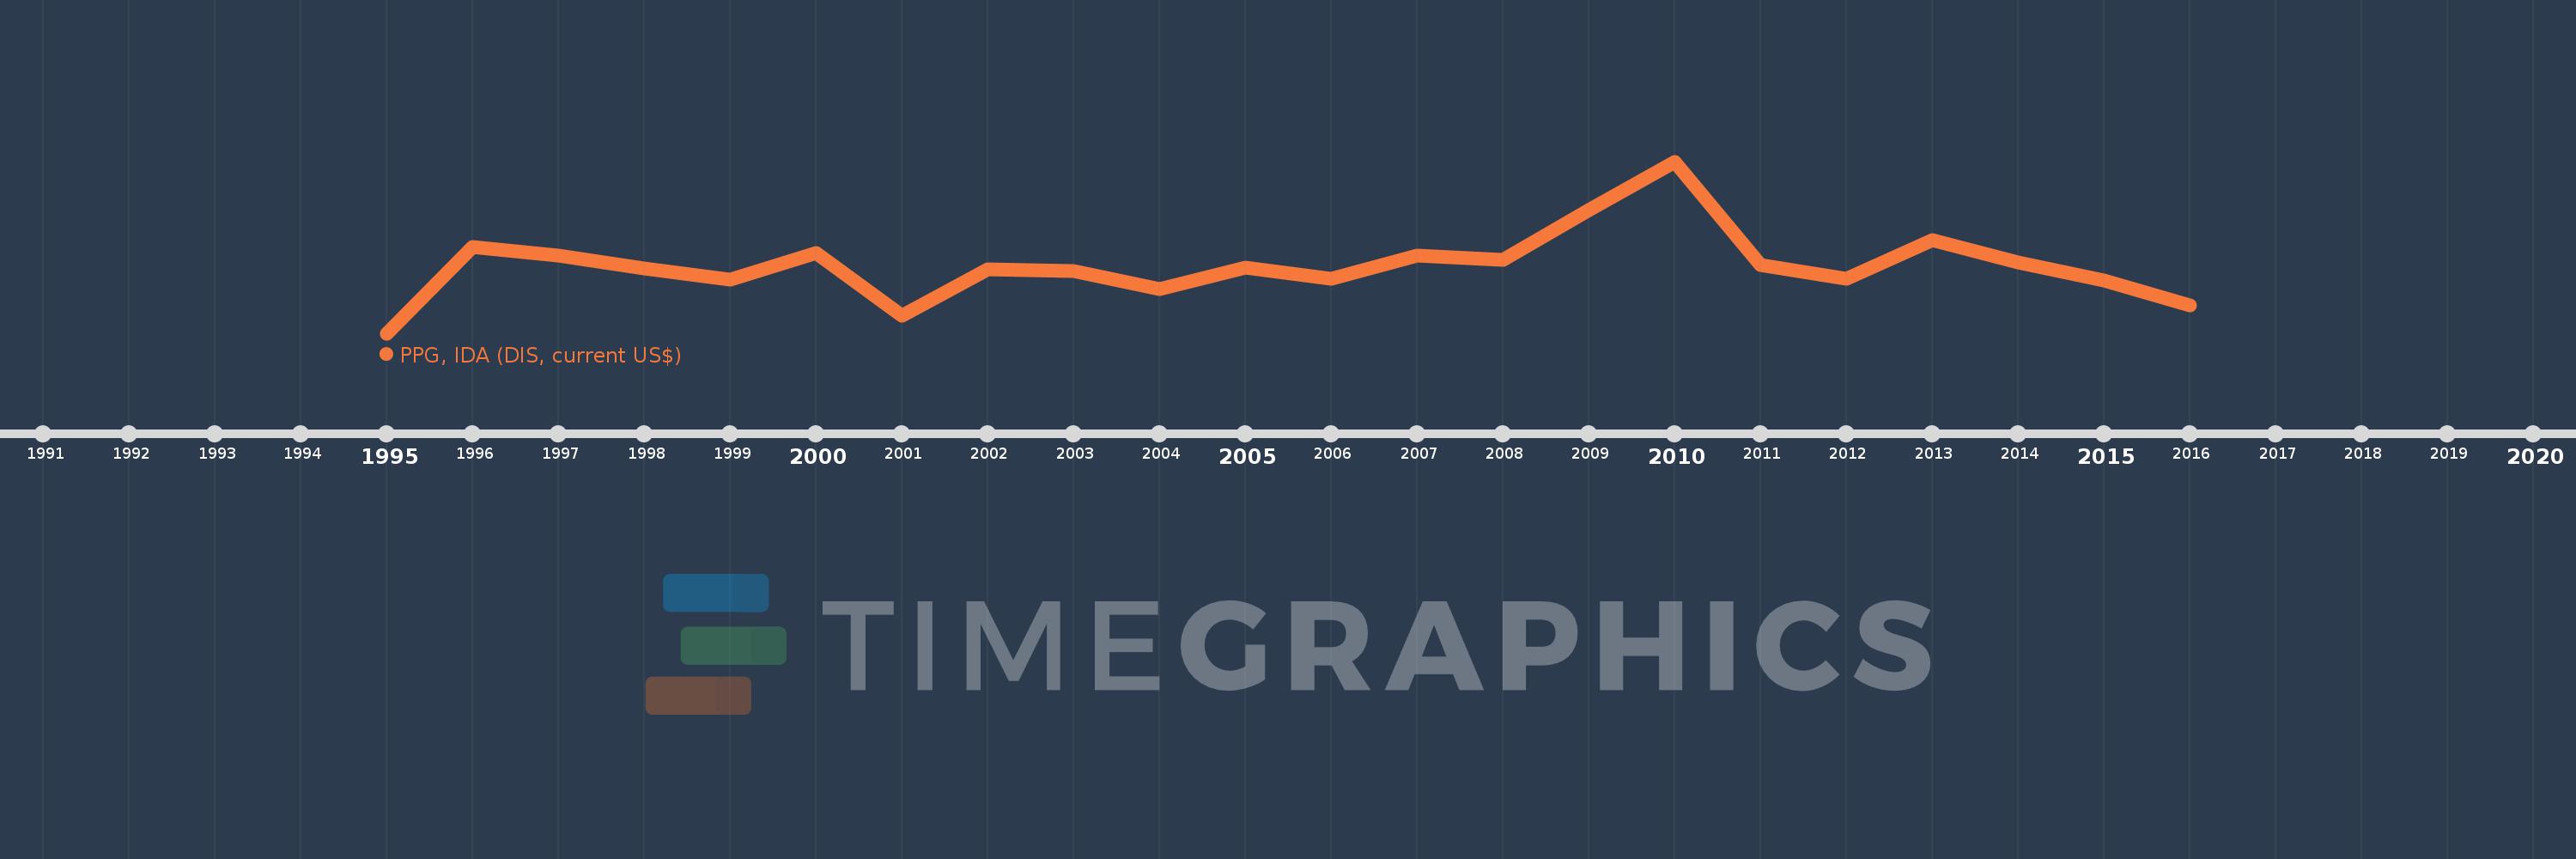
PPG, IDA (DIS, current US$)
2016,2015,2014,2013,2012,2011,2010,2009,2008,2007,2006,2005,2004,2003,2002,2001,2000,1999,1998,1997,1996,1995
This statistics in other country:
Timeline:
This timeline shows a graph from 1995 to 2016 of Georgia. No data until 1994. Number of actual observations by date: 22.
Source name:
World Development Indicators
Source organization:
World Bank, International Debt Statistics.
Categories, topics:
External Debt
Last updated:
apr 23, 2017
Indicators value changes by year
Minimum:
971.0K
jan 1, 1995
Maximum:
167.514 mln
jan 1, 2010
At the date of observation
Value
Absolute change
Change from previous value
jan 1, 1995
971.0K
+971.0K
0.0%
jan 1, 1996
85.059 mln
+84.088 mln
8.66K%
jan 1, 1997
76.337 mln
-8.722 mln
-10.25%
jan 1, 1998
64.25 mln
-12.087 mln
-15.83%
jan 1, 1999
52.902 mln
-11.348 mln
-17.66%
jan 1, 2000
78.839 mln
+25.937 mln
49.03%
jan 1, 2001
18.103 mln
-60.736 mln
-77.04%
jan 1, 2002
63.109 mln
+45.006 mln
248.61%
jan 1, 2003
61.333 mln
-1.776 mln
-2.81%
jan 1, 2004
43.462 mln
-17.871 mln
-29.14%
jan 1, 2005
64.755 mln
+21.293 mln
48.99%
jan 1, 2006
53.73 mln
-11.025 mln
-17.03%
jan 1, 2007
76.227 mln
+22.497 mln
41.87%
jan 1, 2008
72.354 mln
-3.873 mln
-5.08%
jan 1, 2009
120.544 mln
+48.19 mln
66.6%
jan 1, 2010
167.514 mln
+46.97 mln
38.97%
jan 1, 2011
67.446 mln
-100.068 mln
-59.74%
jan 1, 2012
54.123 mln
-13.323 mln
-19.75%
jan 1, 2013
91.346 mln
+37.223 mln
68.77%
jan 1, 2014
70.058 mln
-21.288 mln
-23.3%
jan 1, 2015
52.179 mln
-17.879 mln
-25.52%
jan 1, 2016
27.959 mln
-24.22 mln
-46.42%
Ranking of countries by current statistics by years


Comments: