29
/
en
AIzaSyAYiBZKx7MnpbEhh9jyipgxe19OcubqV5w
April 1, 2024
138582
Georgia
GEO
true
2
1
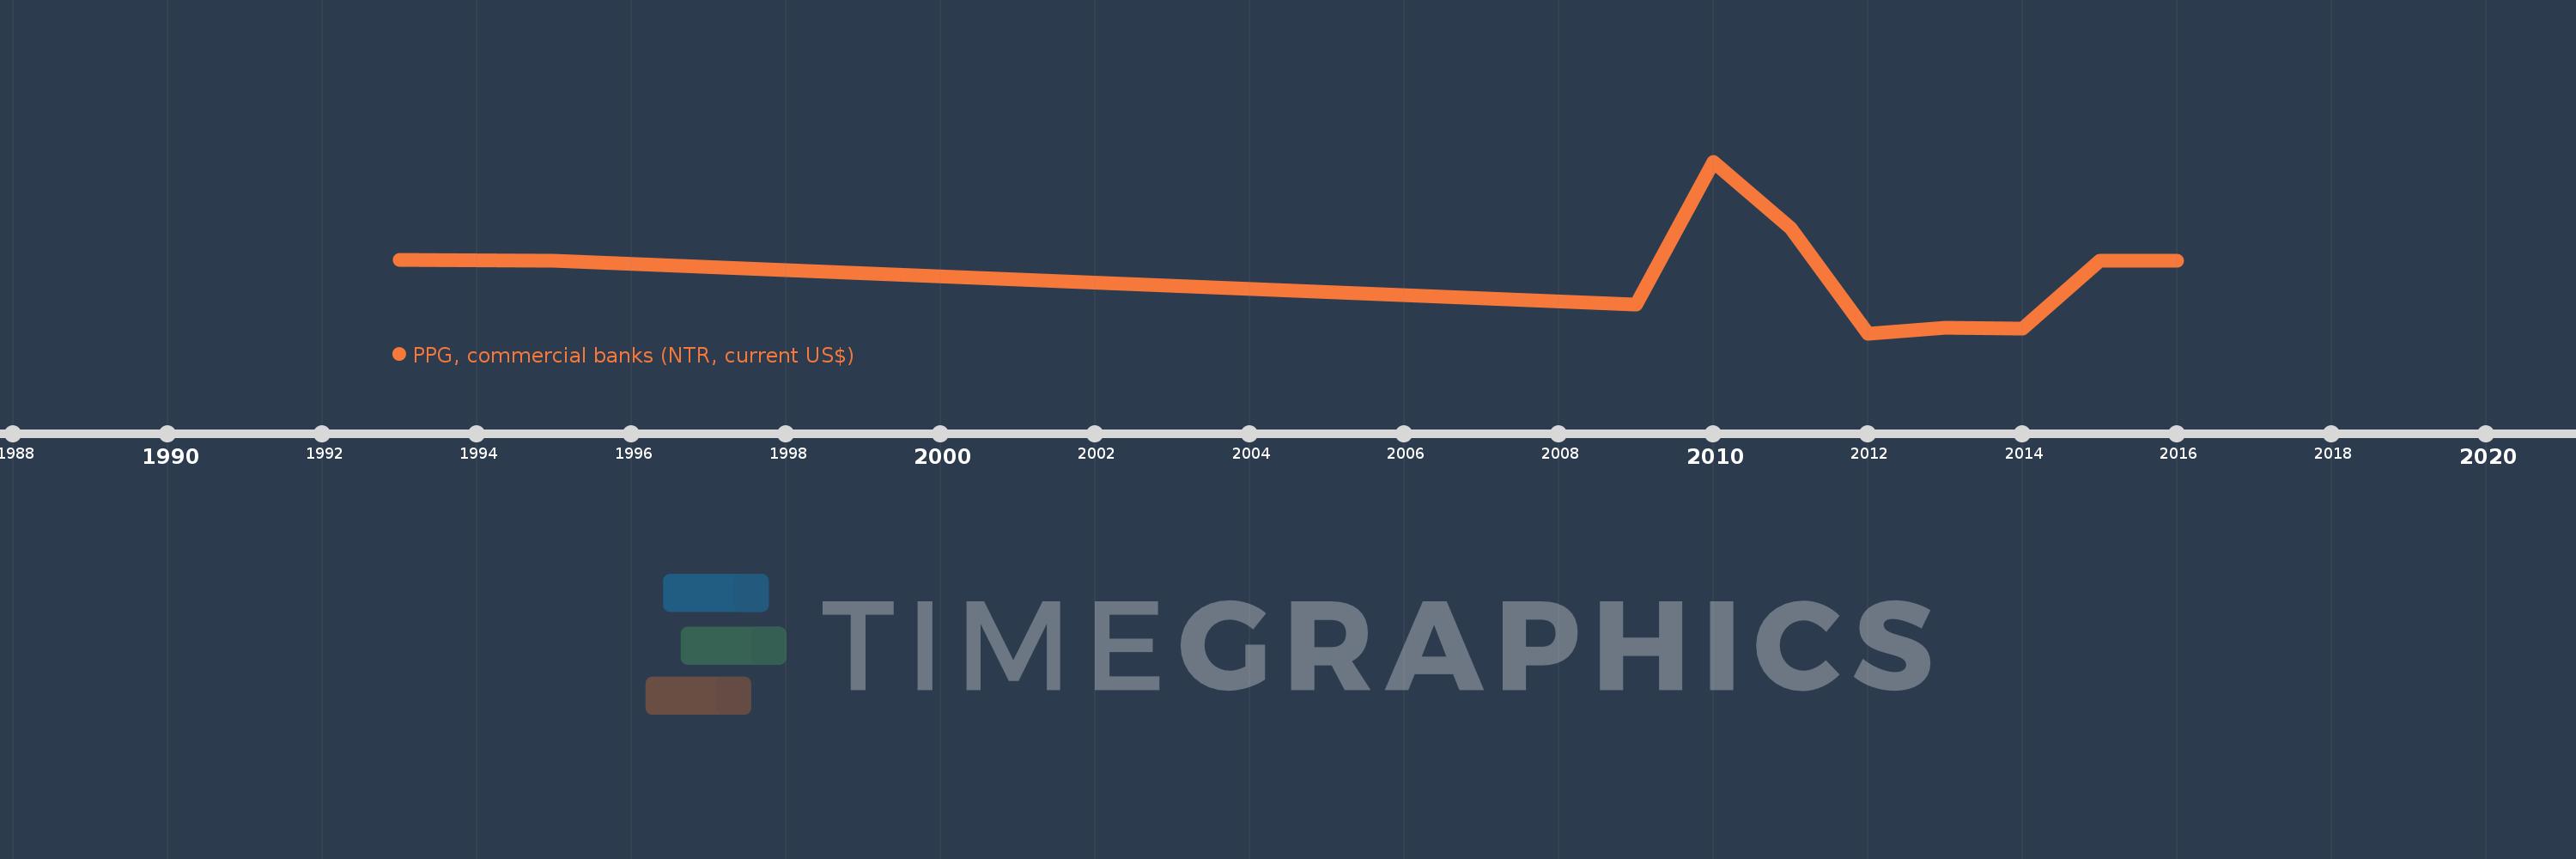
PPG, commercial banks (NTR, current US$)
2016,2015,2014,2013,2012,2011,2010,2009,1995,1993
This statistics in other country:
Timeline:
This timeline shows a graph from 1993 to 2016 of Georgia. No data until 1992. Number of actual observations by date: 10.
Source name:
World Development Indicators
Source organization:
World Bank, International Debt Statistics.
Categories, topics:
External Debt
Last updated:
apr 23, 2017
Indicators value changes by year
Minimum:
-128.135 mln
jan 1, 2012
Maximum:
173.418 mln
jan 1, 2010
At the date of observation
Value
Absolute change
Change from previous value
jan 1, 1993
926.0K
+926.0K
0.0%
jan 1, 1995
-967.0K
-1.893 mln
-204.43%
jan 1, 2009
-77.057 mln
-76.09 mln
7.87K%
jan 1, 2010
173.418 mln
+250.475 mln
-325.05%
jan 1, 2011
56.654 mln
-116.764 mln
-67.33%
jan 1, 2012
-128.135 mln
-184.789 mln
-326.17%
jan 1, 2013
-118.572 mln
+9.563 mln
-7.46%
jan 1, 2014
-119.706 mln
-1.134 mln
0.96%
jan 1, 2015
-140.0K
+119.566 mln
-99.88%
jan 1, 2016
-816.0K
-676.0K
482.86%
Ranking of countries by current statistics by years


Comments: