29
/
en
AIzaSyAYiBZKx7MnpbEhh9jyipgxe19OcubqV5w
April 1, 2024
137760
Georgia
GEO
true
2
1
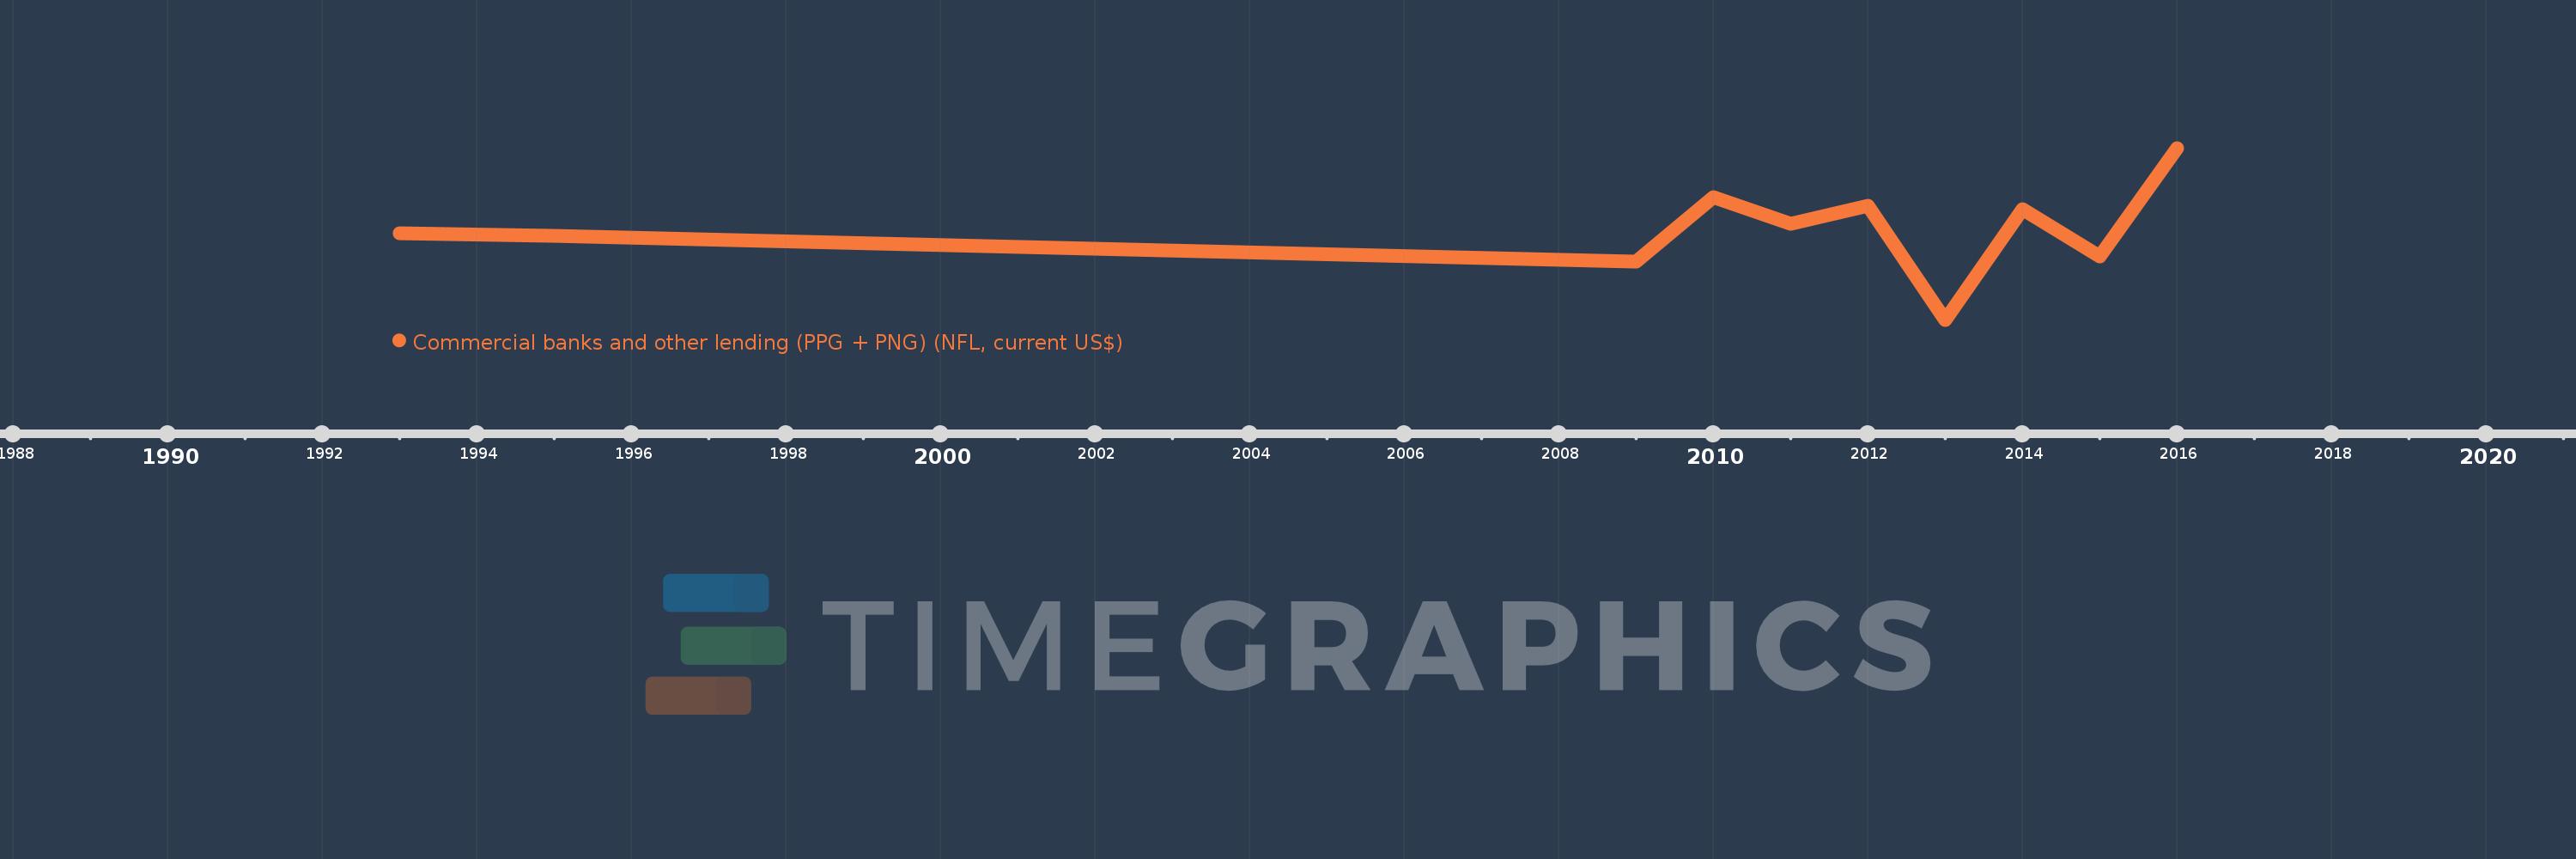
Commercial banks and other lending (PPG + PNG) (NFL, current US$)
2016,2015,2014,2013,2012,2011,2010,2009,1995,1993
This statistics in other country:
Timeline:
This timeline shows a graph from 1993 to 2016 of Georgia. No data until 1992. Number of actual observations by date: 10.
Source name:
World Development Indicators
Source organization:
World Bank, International Debt Statistics.
Categories, topics:
External Debt
Last updated:
apr 23, 2017
Indicators value changes by year
Minimum:
-691.897 mln
jan 1, 2013
Maximum:
719.409 mln
jan 1, 2016
At the date of observation
Value
Absolute change
Change from previous value
jan 1, 1993
21.45 mln
+21.45 mln
0.0%
jan 1, 1995
-926.0K
-22.376 mln
-104.32%
jan 1, 2009
-215.089 mln
-214.163 mln
23.13K%
jan 1, 2010
316.398 mln
+531.487 mln
-247.1%
jan 1, 2011
99.682 mln
-216.716 mln
-68.49%
jan 1, 2012
245.33 mln
+145.648 mln
146.11%
jan 1, 2013
-691.897 mln
-937.227 mln
-382.03%
jan 1, 2014
219.097 mln
+910.994 mln
-131.67%
jan 1, 2015
-175.313 mln
-394.41 mln
-180.02%
jan 1, 2016
719.409 mln
+894.722 mln
-510.36%
Ranking of countries by current statistics by years


Comments: