29
/
en
AIzaSyAYiBZKx7MnpbEhh9jyipgxe19OcubqV5w
April 1, 2024
137657
Georgia
GEO
true
2
1
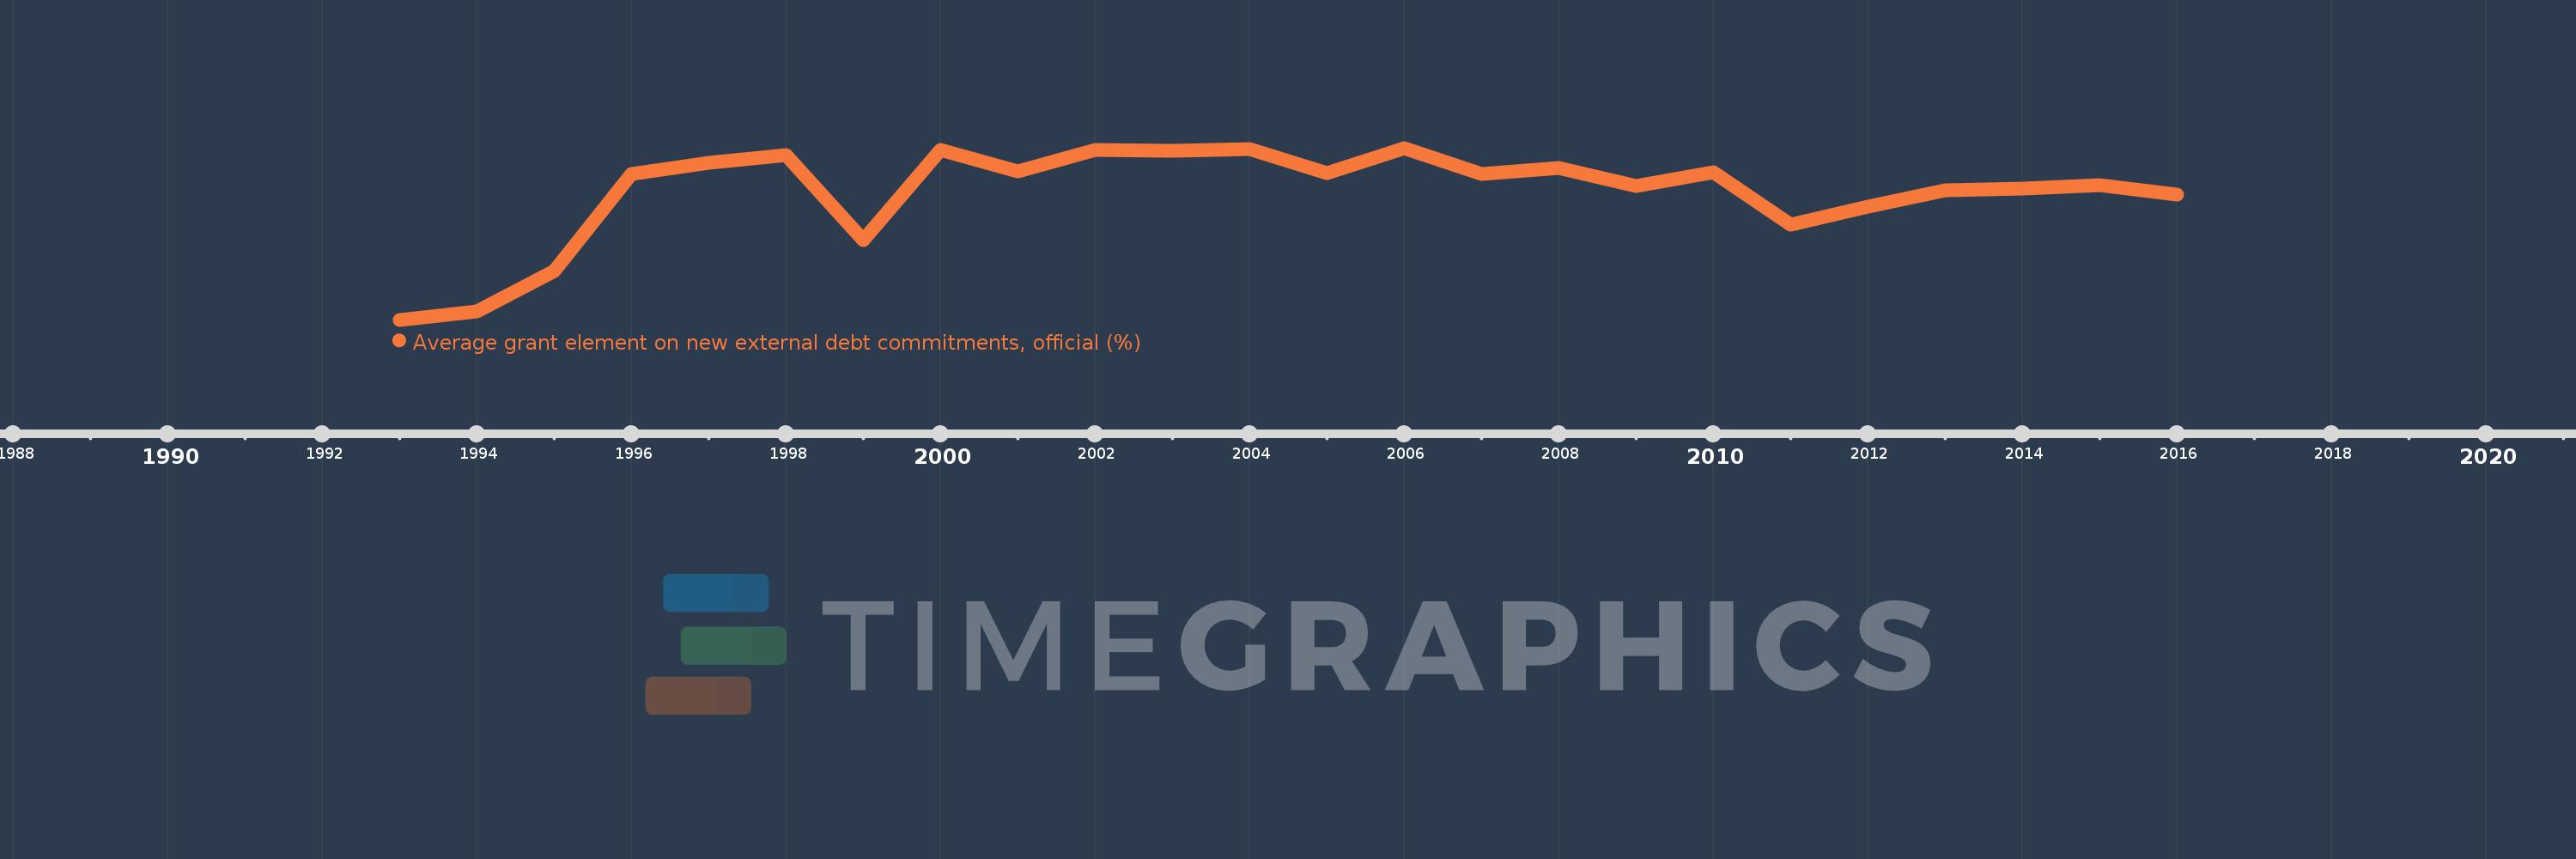
Average grant element on new external debt commitments, official (%)
2016,2015,2014,2013,2012,2011,2010,2009,2008,2007,2006,2005,2004,2003,2002,2001,2000,1999,1998,1997,1996,1995,1994,1993
This statistics in other country:
Timeline:
This timeline shows a graph from 1993 to 2016 of Georgia. No data until 1992. Number of actual observations by date: 24.
Source name:
World Development Indicators
Source organization:
World Bank, International Debt Statistics.
Categories, topics:
External Debt
Last updated:
apr 23, 2017
Indicators value changes by year
Minimum:
15.384
jan 1, 1993
Maximum:
81.114
jan 1, 2006
At the date of observation
Value
Absolute change
Change from previous value
jan 1, 1993
15.384
+15.384
0.0%
jan 1, 1994
18.726
+3.342
21.72%
jan 1, 1995
34.049
+15.324
81.83%
jan 1, 1996
71.305
+37.255
109.42%
jan 1, 1997
75.328
+4.024
5.64%
jan 1, 1998
78.41
+3.082
4.09%
jan 1, 1999
45.884
-32.526
-41.48%
jan 1, 2000
80.46
+34.576
75.36%
jan 1, 2001
72.182
-8.279
-10.29%
jan 1, 2002
80.352
+8.17
11.32%
jan 1, 2003
80.144
-0.208
-0.26%
jan 1, 2004
80.69
+0.547
0.68%
jan 1, 2005
71.609
-9.081
-11.25%
jan 1, 2006
81.114
+9.505
13.27%
jan 1, 2007
71.248
-9.866
-12.16%
jan 1, 2008
73.299
+2.051
2.88%
jan 1, 2009
66.716
-6.583
-8.98%
jan 1, 2010
71.707
+4.991
7.48%
jan 1, 2011
51.623
-20.084
-28.01%
jan 1, 2012
58.64
+7.017
13.59%
jan 1, 2013
64.757
+6.116
10.43%
jan 1, 2014
65.586
+0.829
1.28%
jan 1, 2015
66.954
+1.369
2.09%
jan 1, 2016
63.278
-3.676
-5.49%
Ranking of countries by current statistics by years


Comments: