29
/
en
AIzaSyAYiBZKx7MnpbEhh9jyipgxe19OcubqV5w
April 1, 2024
133694
Finland
FIN
true
2
1
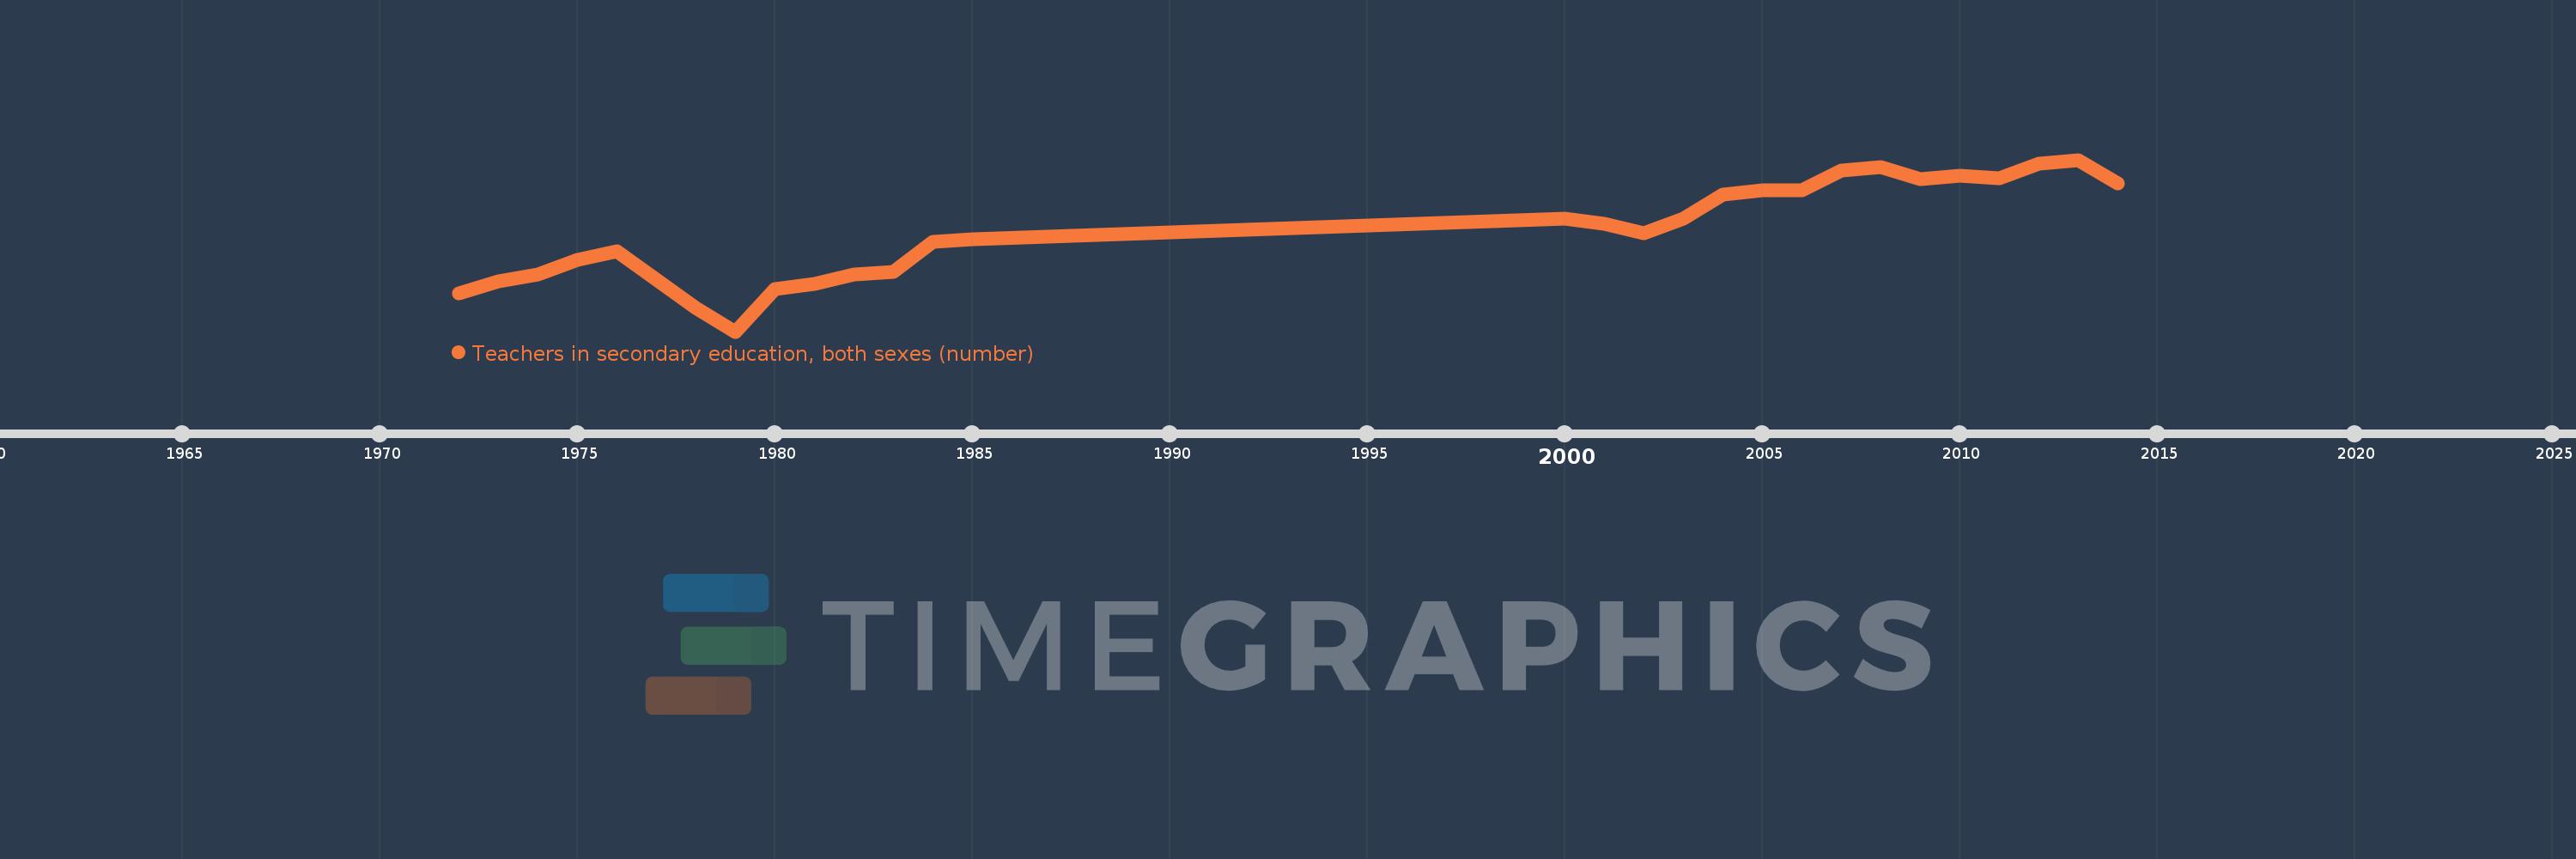
Teachers in secondary education, both sexes (number)
2014,2013,2012,2011,2010,2009,2008,2007,2006,2005,2004,2003,2002,2001,2000,1985,1984,1983,1982,1981,1980,1979,1978,1976,1975,1974,1973,1972
This statistics in other country:
AfghanistanAlbaniaAlgeriaAmerican SamoaAndorraAngolaAntigua and BarbudaArab WorldArgentinaArmeniaArubaAustraliaAustriaBahamas, TheBahrainBangladeshBarbadosBelarusBelgiumBelizeBeninBermudaBhutanBoliviaBosnia and HerzegovinaBotswanaBrazilBritish Virgin IslandsBrunei DarussalamBulgariaBurkina FasoBurundiCabo VerdeCambodiaCameroonCanadaCaribbean small statesCayman IslandsCentral African RepublicCentral Europe and the BalticsChadChileChinaColombiaComorosCongo, Dem. Rep.Congo, Rep.Costa RicaCote d'IvoireCroatiaCubaCyprusCzech RepublicDenmarkDjiboutiDominicaDominican RepublicEarly-demographic dividendEast Asia & PacificEast Asia & Pacific (excluding high income)East Asia & Pacific (IDA & IBRD countries)EcuadorEgypt, Arab Rep.El SalvadorEquatorial GuineaEritreaEstoniaEthiopiaEuro areaEurope & Central AsiaEurope & Central Asia (excluding high income)Europe & Central Asia (IDA & IBRD countries)European UnionFijiFinlandFragile and conflict affected situationsFranceFrench PolynesiaGabonGambia, TheGeorgiaGermanyGhanaGibraltarGreeceGrenadaGuamGuatemalaGuineaGuinea-BissauGuyanaHaitiHeavily indebted poor countries (HIPC)High incomeHondurasHong Kong SAR, ChinaHungaryIBRD onlyIcelandIDA & IBRD totalIDA blendIDA onlyIDA totalIndiaIndonesiaIran, Islamic Rep.IraqIrelandIsraelItalyJamaicaJapanJordanKazakhstanKenyaKiribatiKorea, Dem. People’s Rep.Korea, Rep.KuwaitKyrgyz RepublicLao PDRLate-demographic dividendLatin America & Caribbean Latin America & Caribbean (excluding high income)Latin America & the Caribbean (IDA & IBRD countries)LatviaLeast developed countries: UN classificationLebanonLesothoLiberiaLibyaLiechtensteinLithuaniaLow & middle incomeLow incomeLower middle incomeLuxembourgMacao SAR, ChinaMacedonia, FYRMadagascarMalawiMalaysiaMaldivesMaliMaltaMarshall IslandsMauritaniaMauritiusMexicoMiddle East & North AfricaMiddle East & North Africa (excluding high income)Middle East & North Africa (IDA & IBRD countries)Middle incomeMoldovaMonacoMongoliaMoroccoMozambiqueMyanmarNamibiaNauruNepalNetherlandsNew CaledoniaNew ZealandNicaraguaNigerNigeriaNorth AmericaNorwayOECD membersOmanOther small statesPacific island small statesPakistanPalauPanamaPapua New GuineaParaguayPeruPhilippinesPolandPortugalPost-demographic dividendPre-demographic dividendPuerto RicoQatarRomaniaRussian FederationRwandaSamoaSan MarinoSao Tome and PrincipeSaudi ArabiaSenegalSerbiaSeychellesSierra LeoneSingaporeSint Maarten (Dutch part)Slovak RepublicSloveniaSmall statesSolomon IslandsSomaliaSouth AfricaSouth AsiaSouth Asia (IDA & IBRD)SpainSri LankaSt. Kitts and NevisSt. LuciaSt. Vincent and the GrenadinesSub-Saharan Africa Sub-Saharan Africa (excluding high income)Sub-Saharan Africa (IDA & IBRD countries)SudanSurinameSwazilandSwedenSwitzerlandSyrian Arab RepublicTajikistanTanzaniaThailandTimor-LesteTogoTongaTrinidad and TobagoTunisiaTurkeyTurks and Caicos IslandsUgandaUkraineUnited Arab EmiratesUnited KingdomUnited StatesUpper middle incomeUruguayUzbekistanVanuatuVenezuela, RBVietnamVirgin Islands (U.S.)West Bank and GazaWorldYemen, Rep.ZambiaZimbabwe Timeline:
This timeline shows a graph from 1972 to 2014 of Finland. No data until 1971. Number of actual observations by date: 28.
Source name:
World Development Indicators
Source organization:
UNESCO Institute for Statistics
Categories, topics:
Education
Last updated:
apr 23, 2017
Indicators value changes by year
Minimum:
28.595K
jan 1, 1979
Maximum:
44.843K
jan 1, 2013
At the date of observation
Value
Absolute change
Change from previous value
jan 1, 1972
32.247K
+32.247K
0.0%
jan 1, 1973
33.351K
+1.104K
3.42%
jan 1, 1974
33.993K
+642.0
1.92%
jan 1, 1975
35.419K
+1.426K
4.19%
jan 1, 1976
36.151K
+732.0
2.07%
jan 1, 1978
30.799K
-5.352K
-14.8%
jan 1, 1979
28.595K
-2.204K
-7.16%
jan 1, 1980
32.65K
+4.055K
14.18%
jan 1, 1981
33.077K
+427.0
1.31%
jan 1, 1982
33.958K
+881.0
2.66%
jan 1, 1983
34.248K
+290.0
0.85%
jan 1, 1984
37.098K
+2.85K
8.32%
jan 1, 1985
37.356K
+258.0
0.7%
jan 1, 2000
39.267K
+1.911K
5.12%
jan 1, 2001
38.776K
-491.0
-1.25%
jan 1, 2002
37.925K
-851.0
-2.19%
jan 1, 2003
39.276K
+1.351K
3.56%
jan 1, 2004
41.555K
+2.279K
5.8%
jan 1, 2005
41.953K
+398.0
0.96%
jan 1, 2006
41.982K
+29.0
0.07%
jan 1, 2007
43.84K
+1.858K
4.43%
jan 1, 2008
44.17K
+330.0
0.75%
jan 1, 2009
42.991K
-1.179K
-2.67%
jan 1, 2010
43.319K
+328.0
0.76%
jan 1, 2011
43.076K
-243.0
-0.56%
jan 1, 2012
44.493K
+1.417K
3.29%
jan 1, 2013
44.843K
+350.0
0.79%
jan 1, 2014
42.578K
-2.265K
-5.05%
Ranking of countries by current statistics by years


Comments: