29
/
en
AIzaSyAYiBZKx7MnpbEhh9jyipgxe19OcubqV5w
April 1, 2024
133420
Finland
FIN
true
2
1
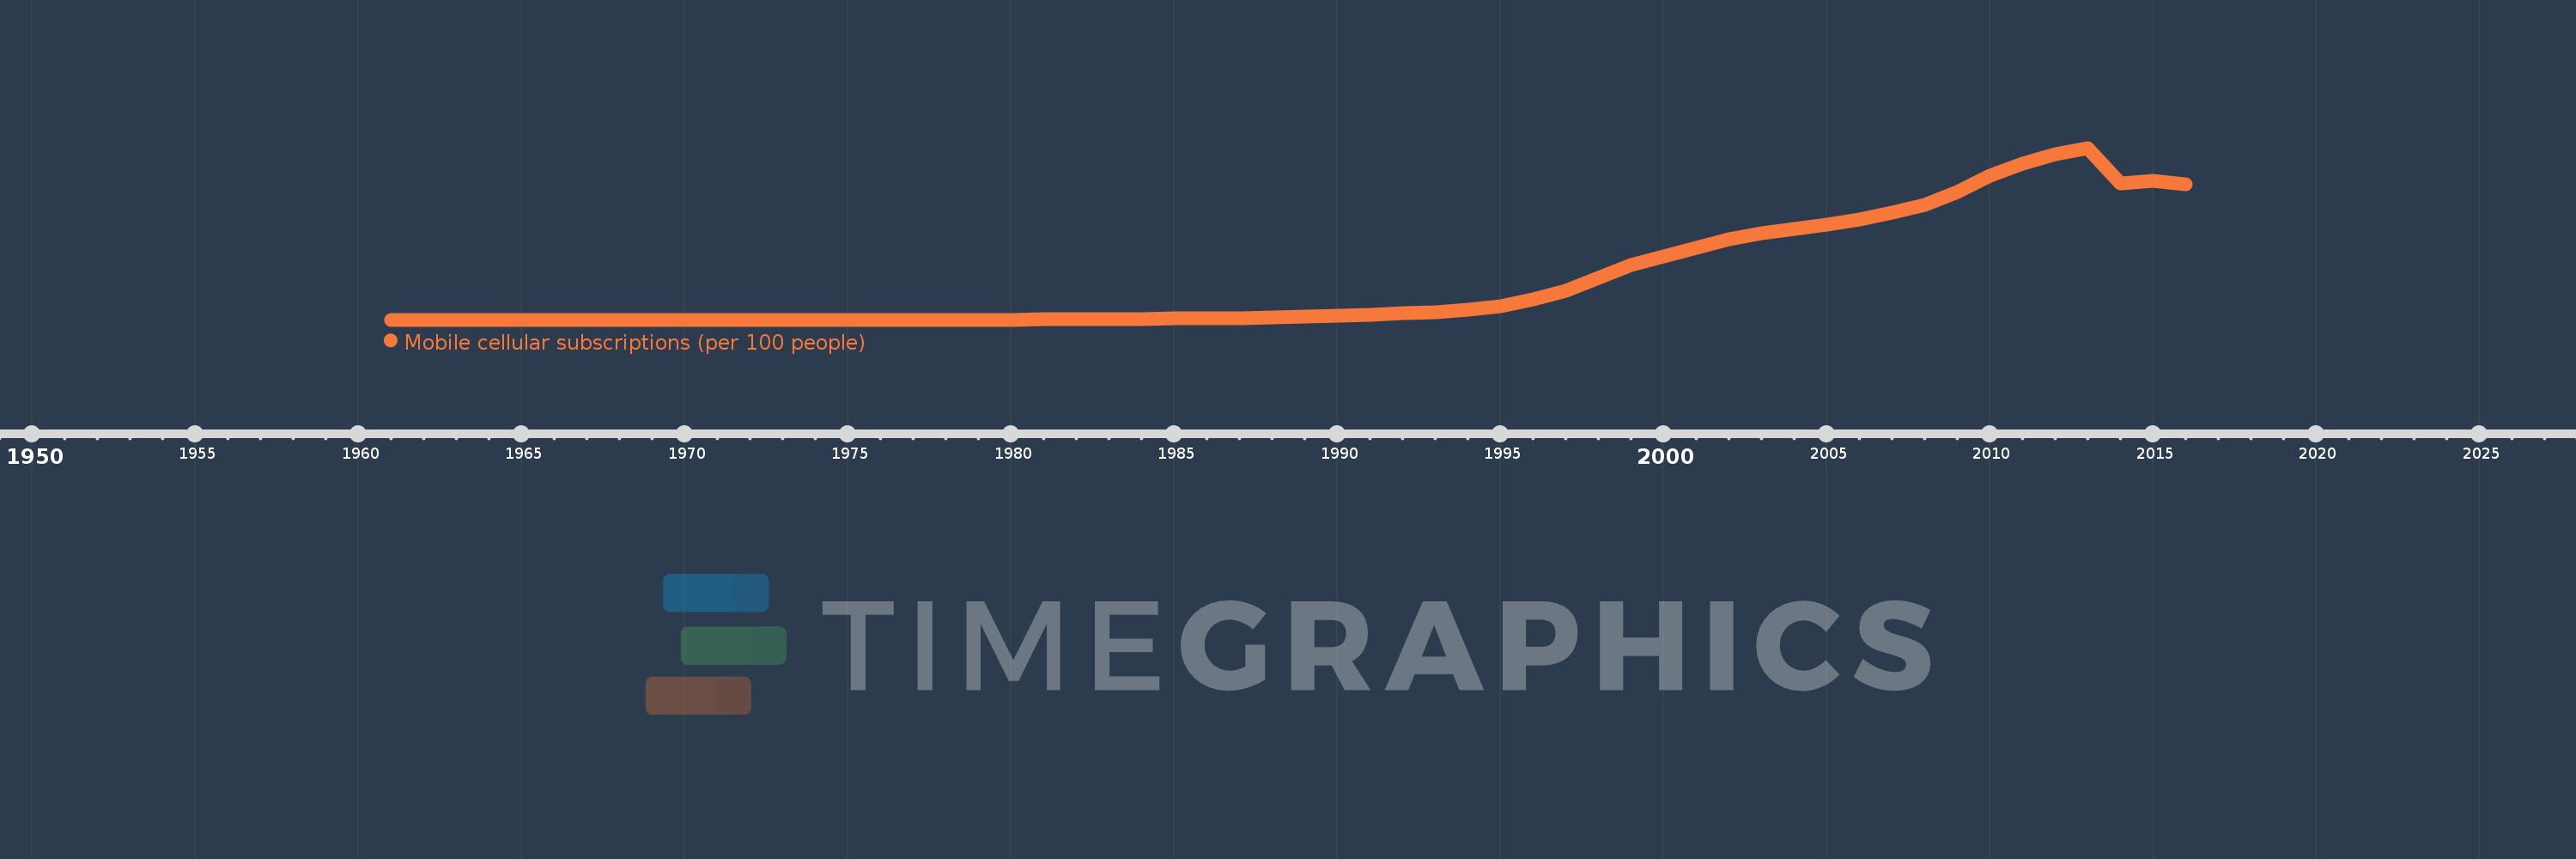
Mobile cellular subscriptions (per 100 people)
2016,2015,2014,2013,2012,2011,2010,2009,2008,2007,2006,2005,2004,2003,2002,2001,2000,1999,1998,1997,1996,1995,1994,1993,1992,1991,1990,1989,1988,1987,1986,1985,1984,1983,1982,1981,1980,1979,1978,1977,1976,1971,1966,1961
This statistics in other country:
AfghanistanAlbaniaAlgeriaAmerican SamoaAndorraAngolaAntigua and BarbudaArab WorldArgentinaArmeniaArubaAustraliaAustriaAzerbaijanBahamas, TheBahrainBangladeshBarbadosBelarusBelgiumBelizeBeninBermudaBhutanBoliviaBosnia and HerzegovinaBotswanaBrazilBritish Virgin IslandsBrunei DarussalamBulgariaBurkina FasoBurundiCabo VerdeCambodiaCameroonCanadaCaribbean small statesCayman IslandsCentral African RepublicCentral Europe and the BalticsChadChileChinaColombiaComorosCongo, Dem. Rep.Congo, Rep.Costa RicaCote d'IvoireCroatiaCubaCuracaoCyprusCzech RepublicDenmarkDjiboutiDominicaDominican RepublicEarly-demographic dividendEast Asia & PacificEast Asia & Pacific (excluding high income)East Asia & Pacific (IDA & IBRD countries)EcuadorEgypt, Arab Rep.El SalvadorEquatorial GuineaEritreaEstoniaEthiopiaEuro areaEurope & Central AsiaEurope & Central Asia (excluding high income)Europe & Central Asia (IDA & IBRD countries)European UnionFaroe IslandsFijiFinlandFragile and conflict affected situationsFranceFrench PolynesiaGabonGambia, TheGeorgiaGermanyGhanaGibraltarGreeceGreenlandGrenadaGuamGuatemalaGuineaGuinea-BissauGuyanaHaitiHeavily indebted poor countries (HIPC)High incomeHondurasHong Kong SAR, ChinaHungaryIBRD onlyIcelandIDA & IBRD totalIDA blendIDA onlyIDA totalIndiaIndonesiaIran, Islamic Rep.IraqIrelandIsraelItalyJamaicaJapanJordanKazakhstanKenyaKiribatiKorea, Dem. People’s Rep.Korea, Rep.KosovoKuwaitKyrgyz RepublicLao PDRLate-demographic dividendLatin America & Caribbean Latin America & Caribbean (excluding high income)Latin America & the Caribbean (IDA & IBRD countries)LatviaLeast developed countries: UN classificationLebanonLesothoLiberiaLibyaLiechtensteinLithuaniaLow & middle incomeLow incomeLower middle incomeLuxembourgMacao SAR, ChinaMacedonia, FYRMadagascarMalawiMalaysiaMaldivesMaliMaltaMarshall IslandsMauritaniaMauritiusMexicoMicronesia, Fed. Sts.Middle East & North AfricaMiddle East & North Africa (excluding high income)Middle East & North Africa (IDA & IBRD countries)Middle incomeMoldovaMonacoMongoliaMontenegroMoroccoMozambiqueMyanmarNamibiaNauruNepalNetherlandsNew CaledoniaNew ZealandNicaraguaNigerNigeriaNorth AmericaNorthern Mariana IslandsNorwayOECD membersOmanOther small statesPacific island small statesPakistanPalauPanamaPapua New GuineaParaguayPeruPhilippinesPolandPortugalPost-demographic dividendPre-demographic dividendPuerto RicoQatarRomaniaRussian FederationRwandaSamoaSan MarinoSao Tome and PrincipeSaudi ArabiaSenegalSerbiaSeychellesSierra LeoneSingaporeSint Maarten (Dutch part)Slovak RepublicSloveniaSmall statesSolomon IslandsSomaliaSouth AfricaSouth AsiaSouth Asia (IDA & IBRD)South SudanSpainSri LankaSt. Kitts and NevisSt. LuciaSt. Vincent and the GrenadinesSub-Saharan Africa Sub-Saharan Africa (excluding high income)Sub-Saharan Africa (IDA & IBRD countries)SudanSurinameSwazilandSwedenSwitzerlandSyrian Arab RepublicTajikistanTanzaniaThailandTimor-LesteTogoTongaTrinidad and TobagoTunisiaTurkeyTurkmenistanTurks and Caicos IslandsTuvaluUgandaUkraineUnited Arab EmiratesUnited KingdomUnited StatesUpper middle incomeUruguayUzbekistanVanuatuVenezuela, RBVietnamVirgin Islands (U.S.)West Bank and GazaWorldYemen, Rep.ZambiaZimbabwe Timeline:
This timeline shows a graph from 1961 to 2016 of Finland. No data until 1960. Number of actual observations by date: 44.
Source name:
World Development Indicators
Source organization:
International Telecommunication Union, World Telecommunication/ICT Development Report and database.
Categories, topics:
Infrastructure
Last updated:
apr 23, 2017
Indicators value changes by year
Maximum:
172.322
jan 1, 2013
At the date of observation
Value
Absolute change
Change from previous value
jan 1, 1981
0.491
+0.491
%
jan 1, 1982
0.589
+0.098
19.89%
jan 1, 1983
0.702
+0.113
19.18%
jan 1, 1984
0.87
+0.168
23.94%
jan 1, 1985
1.066
+0.196
22.51%
jan 1, 1986
1.38
+0.314
29.44%
jan 1, 1987
1.733
+0.354
25.62%
jan 1, 1988
2.144
+0.411
23.7%
jan 1, 1989
2.79
+0.646
30.13%
jan 1, 1990
3.825
+1.035
37.1%
jan 1, 1991
5.171
+1.346
35.18%
jan 1, 1992
6.371
+1.2
23.2%
jan 1, 1993
7.667
+1.296
20.34%
jan 1, 1994
9.665
+1.998
26.06%
jan 1, 1995
13.282
+3.617
37.42%
jan 1, 1996
20.342
+7.061
53.16%
jan 1, 1997
29.302
+8.959
44.04%
jan 1, 1998
42.067
+12.766
43.57%
jan 1, 1999
55.227
+13.16
31.28%
jan 1, 2000
63.38
+8.153
14.76%
jan 1, 2001
72.03
+8.65
13.65%
jan 1, 2002
80.48
+8.45
11.73%
jan 1, 2003
86.857
+6.376
7.92%
jan 1, 2004
91.06
+4.203
4.84%
jan 1, 2005
95.403
+4.344
4.77%
jan 1, 2006
100.45
+5.047
5.29%
jan 1, 2007
107.635
+7.184
7.15%
jan 1, 2008
114.885
+7.25
6.74%
jan 1, 2009
128.425
+13.54
11.79%
jan 1, 2010
144.089
+15.664
12.2%
jan 1, 2011
156.306
+12.217
8.48%
jan 1, 2012
165.891
+9.585
6.13%
jan 1, 2013
172.322
+6.432
3.88%
jan 1, 2014
136.579
-35.744
-20.74%
jan 1, 2015
139.664
+3.085
2.26%
jan 1, 2016
135.5
-4.164
-2.98%
Ranking of countries by current statistics by years


Comments: