29
/
en
AIzaSyAYiBZKx7MnpbEhh9jyipgxe19OcubqV5w
April 1, 2024
132362
Fiji
FJI
true
2
1
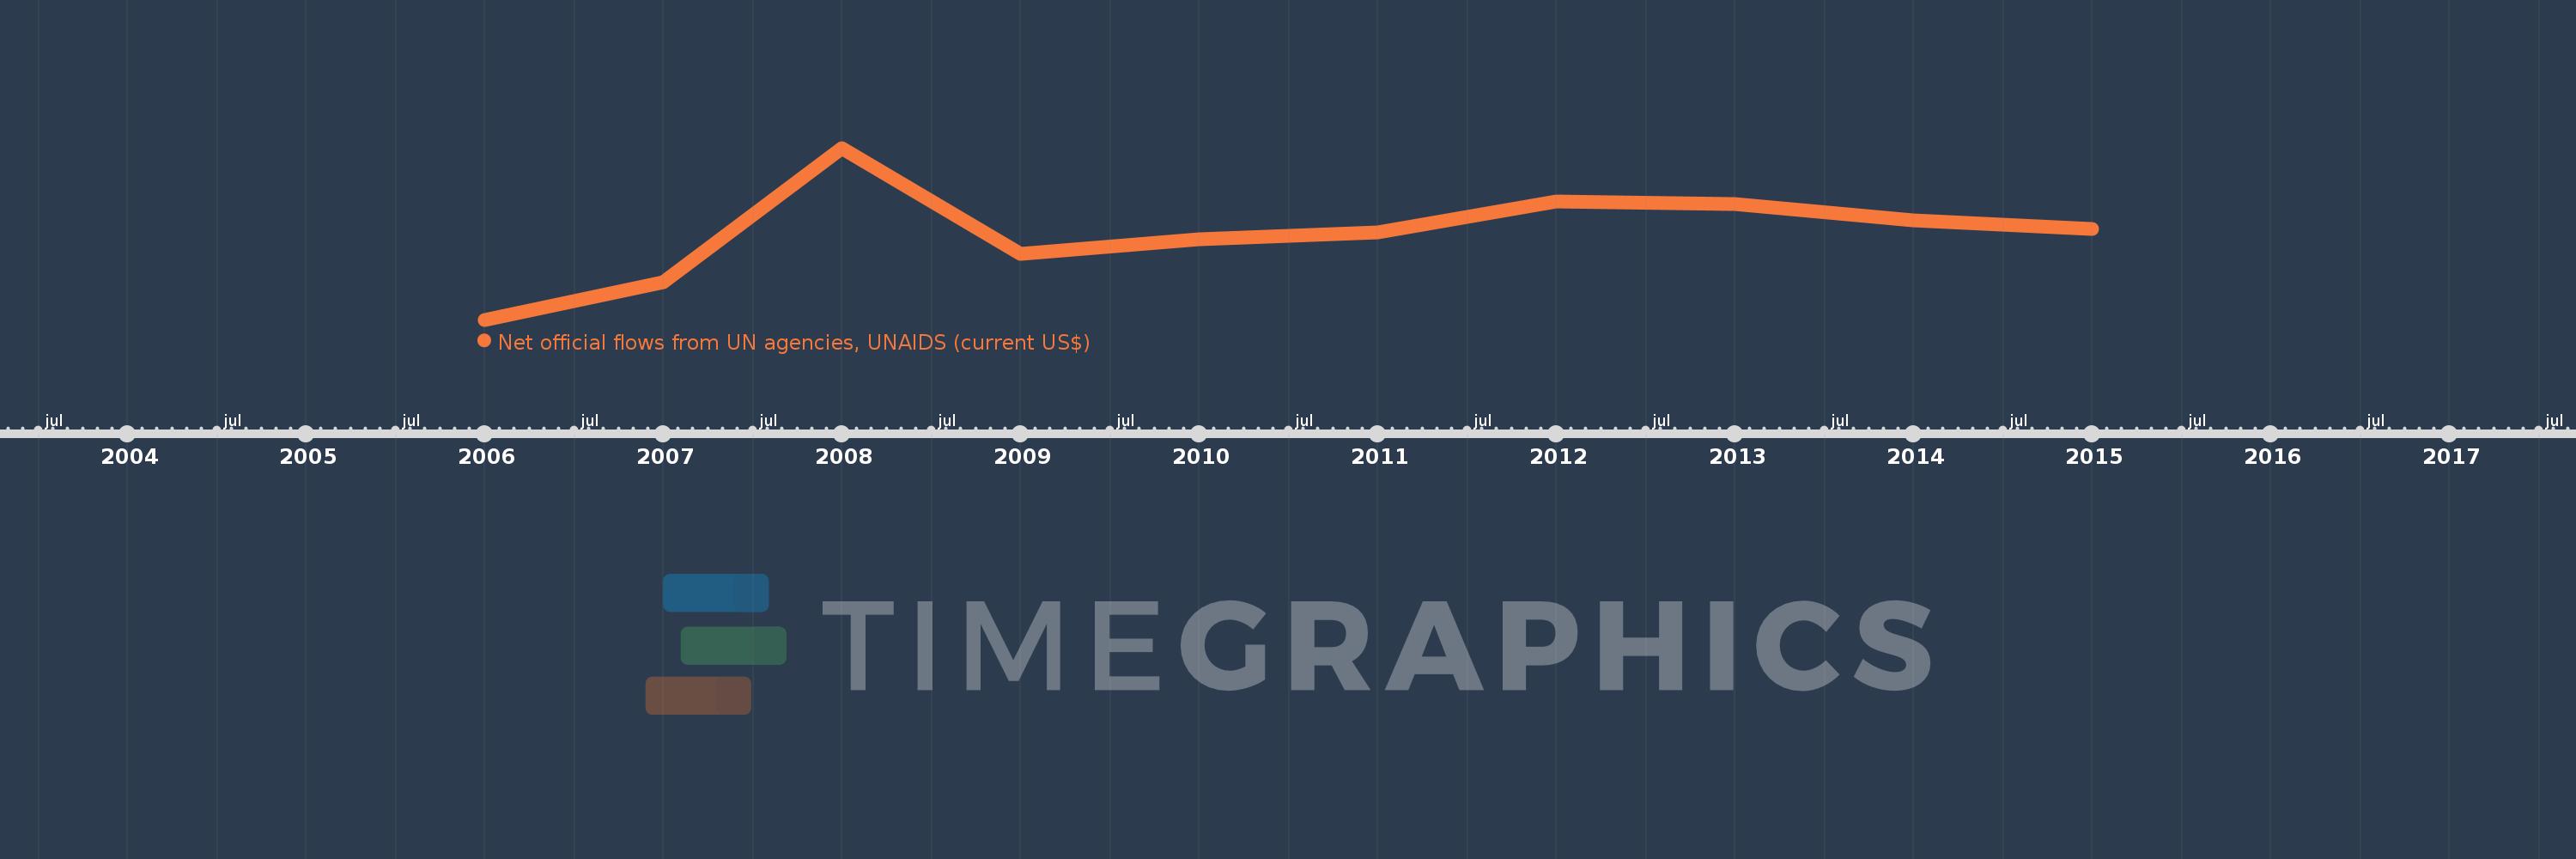
Net official flows from UN agencies, UNAIDS (current US$)
2015,2014,2013,2012,2011,2010,2009,2008,2007,2006
This statistics in other country:
Timeline:
This timeline shows a graph from 2006 to 2015 of Fiji. No data until 2005. Number of actual observations by date: 10.
Source name:
World Development Indicators
Source organization:
Development Assistance Committee of the Organisation for Economic Co-operation and Development, Geographical Distribution of Financial Flows to Developing Countries, Development Co-operation Report, and International Development Statistics database. Data are available online at: www.oecd.org/dac/stats/idsonline.
Categories, topics:
Aid Effectiveness
Last updated:
apr 23, 2017
Indicators value changes by year
Minimum:
160.0K
jan 1, 2006
Maximum:
990.0K
jan 1, 2008
At the date of observation
Value
Absolute change
Change from previous value
jan 1, 2006
160.0K
+160.0K
0.0%
jan 1, 2007
340.0K
+180.0K
112.5%
jan 1, 2008
990.0K
+650.0K
191.18%
jan 1, 2009
480.0K
-510.0K
-51.52%
jan 1, 2010
550.0K
+70.0K
14.58%
jan 1, 2011
580.0K
+30.0K
5.45%
jan 1, 2012
730.0K
+150.0K
25.86%
jan 1, 2013
720.0K
-10.0K
-1.37%
jan 1, 2014
640.0K
-80.0K
-11.11%
jan 1, 2015
600.0K
-40.0K
-6.25%
Ranking of countries by current statistics by years


Comments: