29
/
en
AIzaSyAYiBZKx7MnpbEhh9jyipgxe19OcubqV5w
April 1, 2024
129779
Estonia
EST
true
2
1
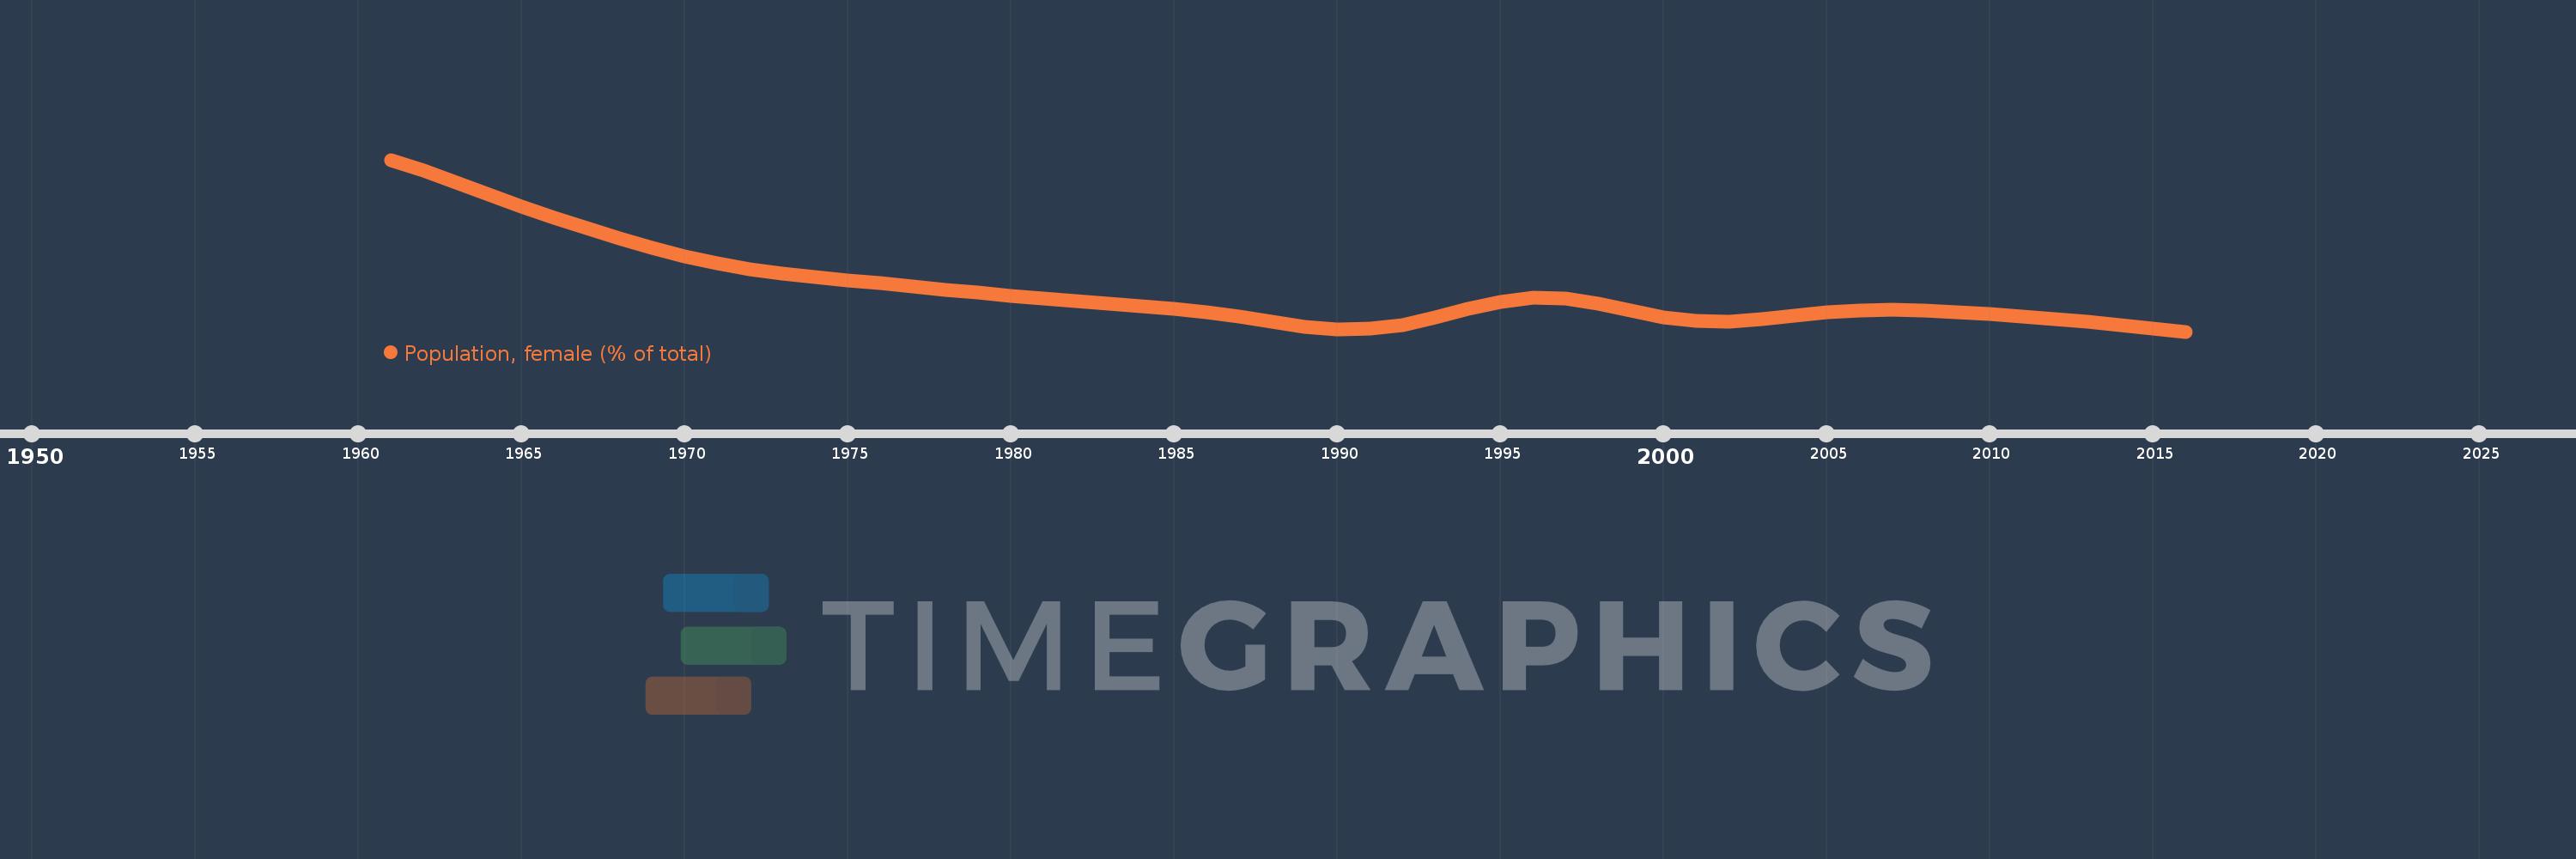
Population, female (% of total)
2016,2015,2014,2013,2012,2011,2010,2009,2008,2007,2006,2005,2004,2003,2002,2001,2000,1999,1998,1997,1996,1995,1994,1993,1992,1991,1990,1989,1988,1987,1986,1985,1984,1983,1982,1981,1980,1979,1978,1977,1976,1975,1974,1973,1972,1971,1970,1969,1968,1967,1966,1965,1964,1963,1962,1961
This statistics in other country:
AfghanistanAlbaniaAlgeriaAngolaAntigua and BarbudaArab WorldArgentinaArmeniaArubaAustraliaAustriaAzerbaijanBahamas, TheBahrainBangladeshBarbadosBelarusBelgiumBelizeBeninBhutanBoliviaBosnia and HerzegovinaBotswanaBrazilBrunei DarussalamBulgariaBurkina FasoBurundiCabo VerdeCambodiaCameroonCanadaCaribbean small statesCentral African RepublicCentral Europe and the BalticsChadChannel IslandsChileChinaColombiaComorosCongo, Dem. Rep.Congo, Rep.Costa RicaCote d'IvoireCroatiaCubaCuracaoCyprusCzech RepublicDenmarkDjiboutiDominican RepublicEarly-demographic dividendEast Asia & PacificEast Asia & Pacific (excluding high income)East Asia & Pacific (IDA & IBRD countries)EcuadorEgypt, Arab Rep.El SalvadorEquatorial GuineaEritreaEstoniaEthiopiaEuro areaEurope & Central AsiaEurope & Central Asia (excluding high income)Europe & Central Asia (IDA & IBRD countries)European UnionFijiFinlandFragile and conflict affected situationsFranceFrench PolynesiaGabonGambia, TheGeorgiaGermanyGhanaGreeceGrenadaGuamGuatemalaGuineaGuinea-BissauGuyanaHaitiHeavily indebted poor countries (HIPC)High incomeHondurasHong Kong SAR, ChinaHungaryIBRD onlyIcelandIDA & IBRD totalIDA blendIDA onlyIDA totalIndiaIndonesiaIran, Islamic Rep.IraqIrelandIsraelItalyJamaicaJapanJordanKazakhstanKenyaKiribatiKorea, Dem. People’s Rep.Korea, Rep.KosovoKuwaitKyrgyz RepublicLao PDRLate-demographic dividendLatin America & Caribbean Latin America & Caribbean (excluding high income)Latin America & the Caribbean (IDA & IBRD countries)LatviaLeast developed countries: UN classificationLebanonLesothoLiberiaLibyaLithuaniaLow & middle incomeLow incomeLower middle incomeLuxembourgMacao SAR, ChinaMacedonia, FYRMadagascarMalawiMalaysiaMaldivesMaliMaltaMauritaniaMauritiusMexicoMicronesia, Fed. Sts.Middle East & North AfricaMiddle East & North Africa (excluding high income)Middle East & North Africa (IDA & IBRD countries)Middle incomeMoldovaMongoliaMontenegroMoroccoMozambiqueMyanmarNamibiaNepalNetherlandsNew CaledoniaNew ZealandNicaraguaNigerNigeriaNorth AmericaNorwayOECD membersOmanOther small statesPacific island small statesPakistanPanamaPapua New GuineaParaguayPeruPhilippinesPolandPortugalPost-demographic dividendPre-demographic dividendPuerto RicoQatarRomaniaRussian FederationRwandaSamoaSao Tome and PrincipeSaudi ArabiaSenegalSerbiaSeychellesSierra LeoneSingaporeSlovak RepublicSloveniaSmall statesSolomon IslandsSomaliaSouth AfricaSouth AsiaSouth Asia (IDA & IBRD)South SudanSpainSri LankaSt. LuciaSt. Vincent and the GrenadinesSub-Saharan Africa Sub-Saharan Africa (excluding high income)Sub-Saharan Africa (IDA & IBRD countries)SudanSurinameSwazilandSwedenSwitzerlandSyrian Arab RepublicTajikistanTanzaniaThailandTimor-LesteTogoTongaTrinidad and TobagoTunisiaTurkeyTurkmenistanUgandaUkraineUnited Arab EmiratesUnited KingdomUnited StatesUpper middle incomeUruguayUzbekistanVanuatuVenezuela, RBVietnamVirgin Islands (U.S.)West Bank and GazaWorldYemen, Rep.ZambiaZimbabwe Timeline:
This timeline shows a graph from 1961 to 2016 of Estonia. No data until 1960. Number of actual observations by date: 56.
Source name:
World Development Indicators
Source organization:
World Bank staff estimates based on male/female distributions of United Nations Population Division's World Population Prospects.
Categories, topics:
Health
Last updated:
apr 23, 2017
Indicators value changes by year
Minimum:
53.197
jan 1, 2016
Maximum:
55.853
jan 1, 1961
At the date of observation
Value
Absolute change
Change from previous value
jan 1, 1961
55.853
+55.853
0.0%
jan 1, 1962
55.686
-0.167
-0.3%
jan 1, 1963
55.506
-0.181
-0.32%
jan 1, 1964
55.318
-0.187
-0.34%
jan 1, 1965
55.134
-0.185
-0.33%
jan 1, 1966
54.958
-0.176
-0.32%
jan 1, 1967
54.792
-0.166
-0.3%
jan 1, 1968
54.634
-0.157
-0.29%
jan 1, 1969
54.49
-0.145
-0.26%
jan 1, 1970
54.362
-0.128
-0.23%
jan 1, 1971
54.253
-0.109
-0.2%
jan 1, 1972
54.165
-0.088
-0.16%
jan 1, 1973
54.095
-0.07
-0.13%
jan 1, 1974
54.039
-0.056
-0.1%
jan 1, 1975
53.99
-0.049
-0.09%
jan 1, 1976
53.942
-0.048
-0.09%
jan 1, 1977
53.893
-0.048
-0.09%
jan 1, 1978
53.845
-0.048
-0.09%
jan 1, 1979
53.798
-0.047
-0.09%
jan 1, 1980
53.752
-0.046
-0.09%
jan 1, 1981
53.708
-0.044
-0.08%
jan 1, 1982
53.668
-0.04
-0.07%
jan 1, 1983
53.632
-0.037
-0.07%
jan 1, 1984
53.594
-0.038
-0.07%
jan 1, 1985
53.549
-0.045
-0.08%
jan 1, 1986
53.495
-0.054
-0.1%
jan 1, 1987
53.425
-0.069
-0.13%
jan 1, 1988
53.345
-0.08
-0.15%
jan 1, 1989
53.273
-0.072
-0.14%
jan 1, 1990
53.233
-0.041
-0.08%
jan 1, 1991
53.238
+0.005
0.01%
jan 1, 1992
53.299
+0.062
0.12%
jan 1, 1993
53.411
+0.112
0.21%
jan 1, 1994
53.546
+0.135
0.25%
jan 1, 1995
53.66
+0.114
0.21%
jan 1, 1996
53.719
+0.059
0.11%
jan 1, 1997
53.704
-0.015
-0.03%
jan 1, 1998
53.627
-0.077
-0.14%
jan 1, 1999
53.517
-0.11
-0.21%
jan 1, 2000
53.417
-0.1
-0.19%
jan 1, 2001
53.359
-0.058
-0.11%
jan 1, 2002
53.351
-0.007
-0.01%
jan 1, 2003
53.384
+0.032
0.06%
jan 1, 2004
53.44
+0.056
0.11%
jan 1, 2005
53.495
+0.055
0.1%
jan 1, 2006
53.529
+0.034
0.06%
jan 1, 2007
53.538
+0.009
0.02%
jan 1, 2008
53.528
-0.011
-0.02%
jan 1, 2009
53.502
-0.026
-0.05%
jan 1, 2010
53.467
-0.035
-0.06%
jan 1, 2011
53.43
-0.037
-0.07%
jan 1, 2012
53.389
-0.04
-0.08%
jan 1, 2013
53.345
-0.045
-0.08%
jan 1, 2014
53.297
-0.048
-0.09%
jan 1, 2015
53.247
-0.05
-0.09%
jan 1, 2016
53.197
-0.05
-0.09%
Ranking of countries by current statistics by years


Comments: