29
/
en
AIzaSyAYiBZKx7MnpbEhh9jyipgxe19OcubqV5w
April 1, 2024
128458
Eritrea
ERI
true
2
1
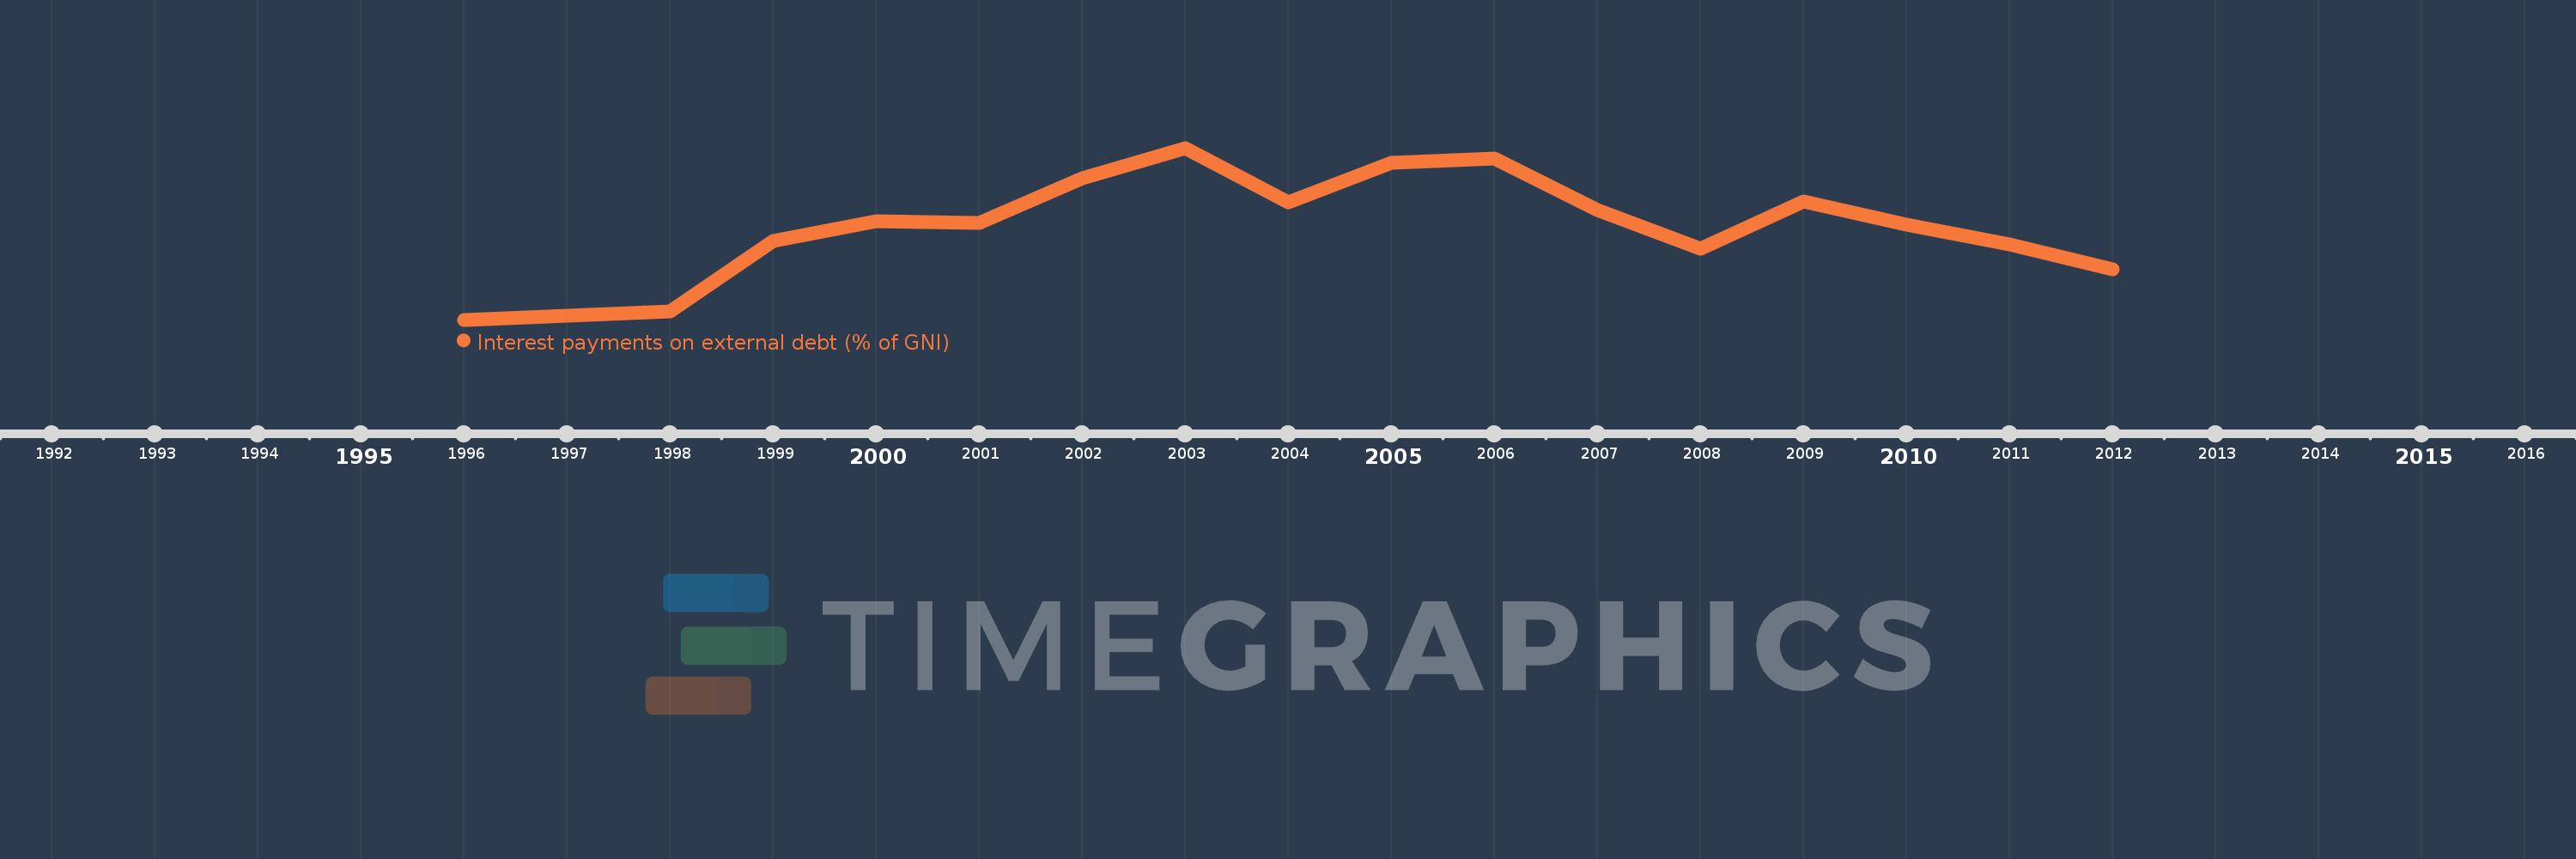
Interest payments on external debt (% of GNI)
2012,2011,2010,2009,2008,2007,2006,2005,2004,2003,2002,2001,2000,1999,1998,1996
This statistics in other country:
Timeline:
This timeline shows a graph from 1996 to 2012 of Eritrea. No data until 1995. Number of actual observations by date: 16.
Source name:
World Development Indicators
Source organization:
World Bank, International Debt Statistics.
Categories, topics:
Economy & Growth, External Debt
Last updated:
apr 23, 2017
Indicators value changes by year
At the date of observation
Value
Absolute change
Change from previous value
jan 1, 1996
0.026
+0.026
0.0%
jan 1, 1998
0.074
+0.048
188.51%
jan 1, 1999
0.474
+0.4
540.79%
jan 1, 2000
0.585
+0.111
23.47%
jan 1, 2001
0.578
-0.007
-1.12%
jan 1, 2002
0.829
+0.25
43.29%
jan 1, 2003
1.004
+0.176
21.19%
jan 1, 2004
0.695
-0.309
-30.74%
jan 1, 2005
0.921
+0.226
32.49%
jan 1, 2006
0.944
+0.023
2.47%
jan 1, 2007
0.652
-0.292
-30.95%
jan 1, 2008
0.431
-0.221
-33.89%
jan 1, 2009
0.699
+0.268
62.13%
jan 1, 2010
0.569
-0.13
-18.6%
jan 1, 2011
0.453
-0.116
-20.35%
jan 1, 2012
0.315
-0.138
-30.46%
Ranking of countries by current statistics by years


Comments: