29
/
en
AIzaSyAYiBZKx7MnpbEhh9jyipgxe19OcubqV5w
April 1, 2024
128258
Eritrea
ERI
true
2
1
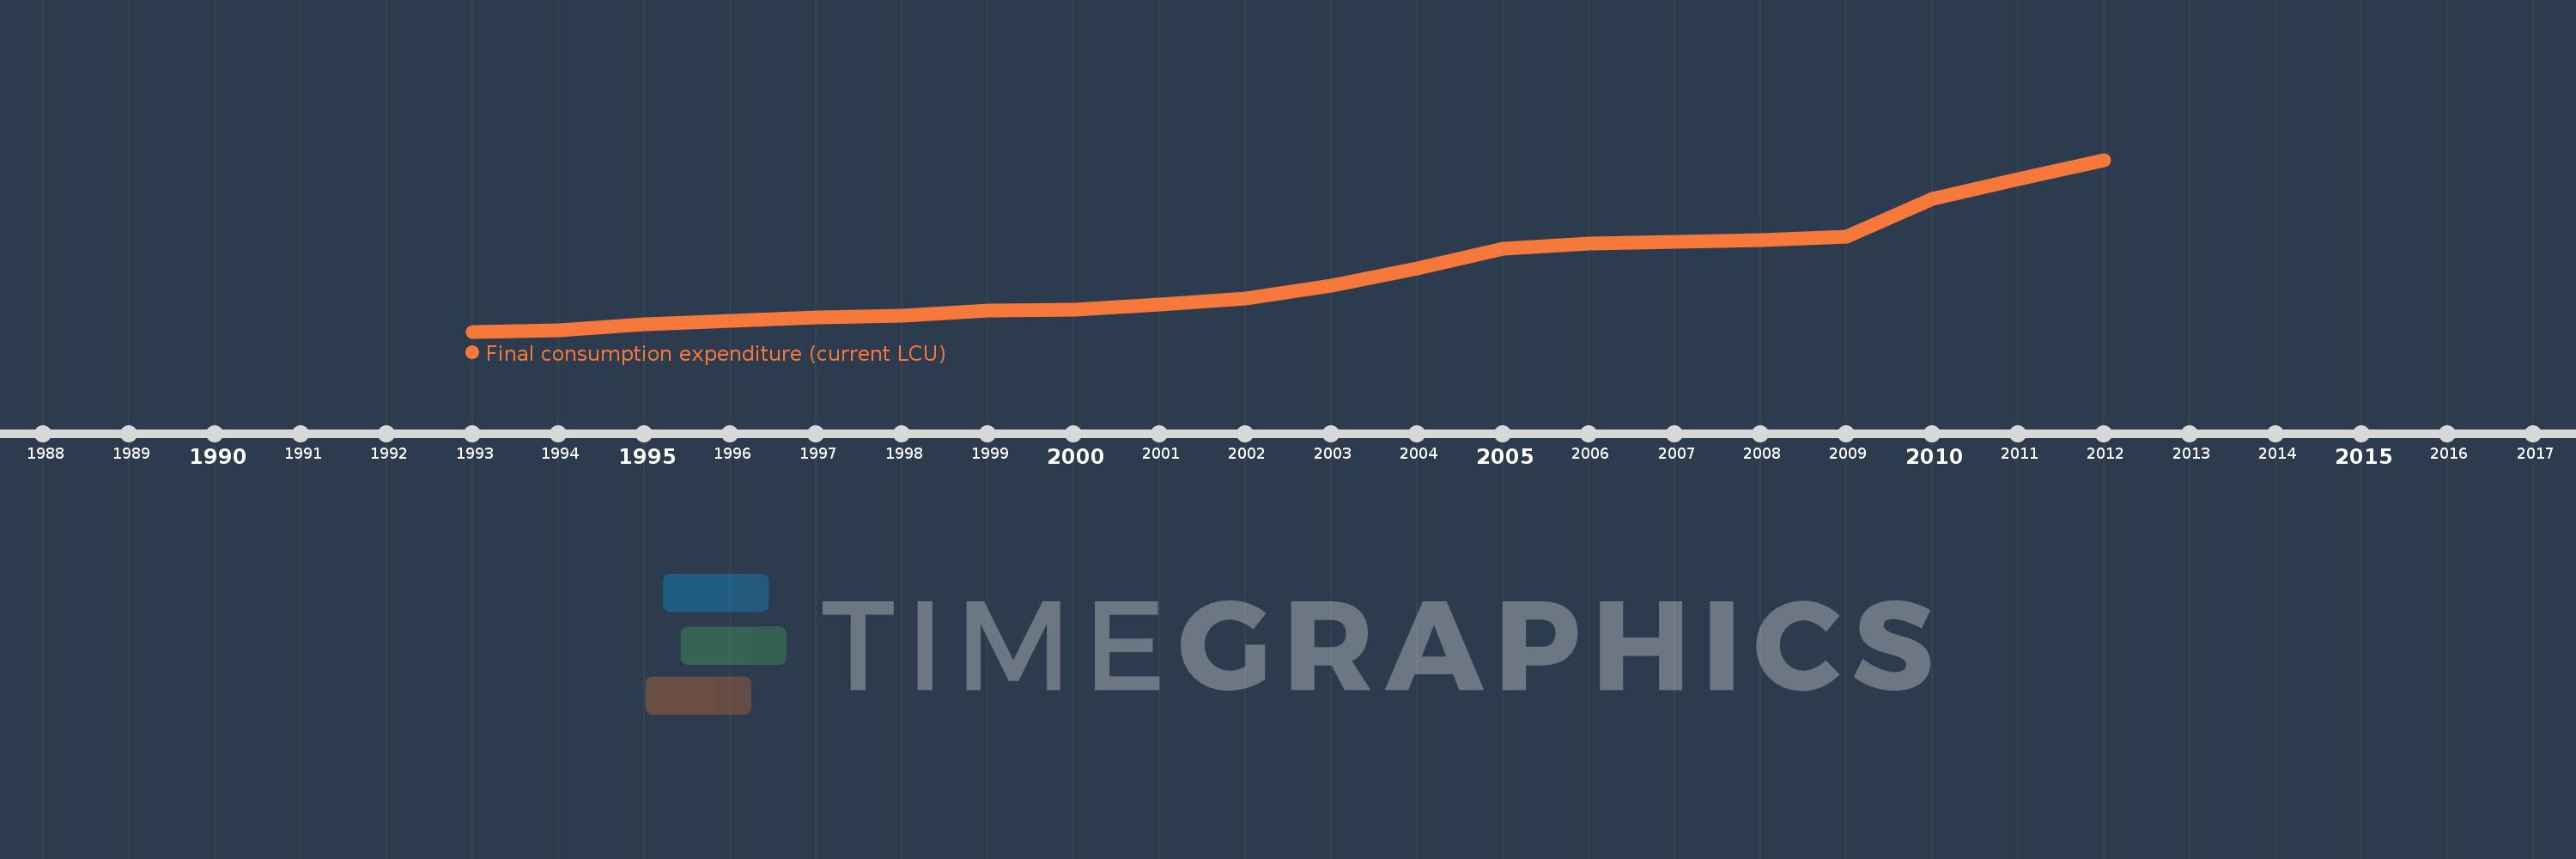
Final consumption expenditure (current LCU)
2012,2011,2010,2009,2008,2007,2006,2005,2004,2003,2002,2001,2000,1999,1998,1997,1996,1995,1994,1993
This statistics in other country:
AfghanistanAlbaniaAlgeriaAngolaAntigua and BarbudaArgentinaArmeniaArubaAustraliaAustriaAzerbaijanBahamas, TheBahrainBangladeshBarbadosBelarusBelgiumBelizeBeninBermudaBhutanBoliviaBosnia and HerzegovinaBotswanaBrazilBrunei DarussalamBulgariaBurkina FasoBurundiCabo VerdeCambodiaCameroonCanadaCentral African RepublicChadChileChinaColombiaComorosCongo, Dem. Rep.Congo, Rep.Costa RicaCote d'IvoireCroatiaCubaCyprusCzech RepublicDenmarkDjiboutiDominicaDominican RepublicEcuadorEgypt, Arab Rep.El SalvadorEquatorial GuineaEritreaEstoniaEthiopiaFaroe IslandsFijiFinlandFranceGabonGambia, TheGeorgiaGermanyGhanaGreeceGrenadaGuatemalaGuineaGuinea-BissauGuyanaHaitiHondurasHong Kong SAR, ChinaHungaryIcelandIndiaIndonesiaIran, Islamic Rep.IrelandIsraelItalyJamaicaJapanJordanKazakhstanKenyaKiribatiKorea, Rep.KosovoKuwaitKyrgyz RepublicLao PDRLatviaLebanonLesothoLiberiaLibyaLithuaniaLuxembourgMacao SAR, ChinaMacedonia, FYRMadagascarMalawiMalaysiaMaliMaltaMauritaniaMauritiusMexicoMicronesia, Fed. Sts.MoldovaMongoliaMontenegroMoroccoMozambiqueNamibiaNepalNetherlandsNew CaledoniaNew ZealandNicaraguaNigerNigeriaNorwayOmanPakistanPanamaPapua New GuineaParaguayPeruPhilippinesPolandPortugalPuerto RicoQatarRomaniaRussian FederationRwandaSaudi ArabiaSenegalSerbiaSeychellesSierra LeoneSingaporeSlovak RepublicSloveniaSolomon IslandsSomaliaSouth AfricaSouth SudanSpainSri LankaSt. Kitts and NevisSt. LuciaSt. Vincent and the GrenadinesSudanSurinameSwazilandSwedenSwitzerlandSyrian Arab RepublicTajikistanTanzaniaThailandTimor-LesteTogoTongaTrinidad and TobagoTunisiaTurkeyUgandaUkraineUnited Arab EmiratesUnited KingdomUnited StatesUruguayUzbekistanVanuatuVenezuela, RBVietnamWest Bank and GazaYemen, Rep.ZambiaZimbabwe Timeline:
This timeline shows a graph from 1993 to 2012 of Eritrea. No data until 1992. Number of actual observations by date: 20.
Source name:
World Development Indicators
Source organization:
World Bank national accounts data, and OECD National Accounts data files.
Categories, topics:
Economy & Growth
Last updated:
apr 23, 2017
Indicators value changes by year
Minimum:
2.749 bln
jan 1, 1993
Maximum:
39.62 bln
jan 1, 2012
At the date of observation
Value
Absolute change
Change from previous value
jan 1, 1993
2.749 bln
+2.749 bln
0.0%
jan 1, 1994
3.044 bln
+294.9 mln
10.73%
jan 1, 1995
4.257 bln
+1.213 bln
39.85%
jan 1, 1996
5.114 bln
+857.3 mln
20.14%
jan 1, 1997
5.756 bln
+641.5 mln
12.54%
jan 1, 1998
6.174 bln
+417.7 mln
7.26%
jan 1, 1999
7.298 bln
+1.125 bln
18.22%
jan 1, 2000
7.396 bln
+97.457 mln
1.34%
jan 1, 2001
8.603 bln
+1.208 bln
16.33%
jan 1, 2002
9.801 bln
+1.198 bln
13.92%
jan 1, 2003
12.57 bln
+2.769 bln
28.25%
jan 1, 2004
16.253 bln
+3.683 bln
29.3%
jan 1, 2005
20.453 bln
+4.2 bln
25.84%
jan 1, 2006
21.68 bln
+1.228 bln
6.0%
jan 1, 2007
21.933 bln
+252.172 mln
1.16%
jan 1, 2008
22.36 bln
+426.933 mln
1.95%
jan 1, 2009
23.128 bln
+768.492 mln
3.44%
jan 1, 2010
31.302 bln
+8.174 bln
35.34%
jan 1, 2011
35.563 bln
+4.261 bln
13.61%
jan 1, 2012
39.62 bln
+4.057 bln
11.41%
Ranking of countries by current statistics by years


Comments: